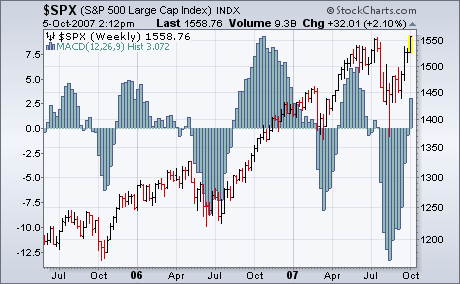
Last Friday, I wrote that the weekly MACD lines hadn't turned positive yet for the S&P 500, but were close to doing so. They turned positive this week. I wrote last Friday that "we need to see a positive crossing by the weekly (MACD) lines (or a histogram move over zero) to confirm that the current rally has enough strength to move to new highs". Both events took place this week. The chart below plots the weekly MACD histogram bars on top of the S&P 500. Intermediate buy and sell signals are given when the histogram bars move above and below the zero line. Since this is weekly indicator, its signal are given much later than signals on daily charts (which turned positive during August). But it's an important confirmation that the current rally has some staying power. It's taken seven weeks from the histogram bottom in mid-August to a bullish crossing. That's not unusual. It took eight weeks for that to happen in the summer of 2006. What is unusual this time is that the bullish crossover took place as the market was hitting a new high. Most often, the weekly MACD lines turn up well before a new high. The reason for this late crossing is the unusually deep correction this summer. The histogram bars fell to the lowest level in four years. That's why it took it so long to turn positive. It's a late signal, but an encouraging one.