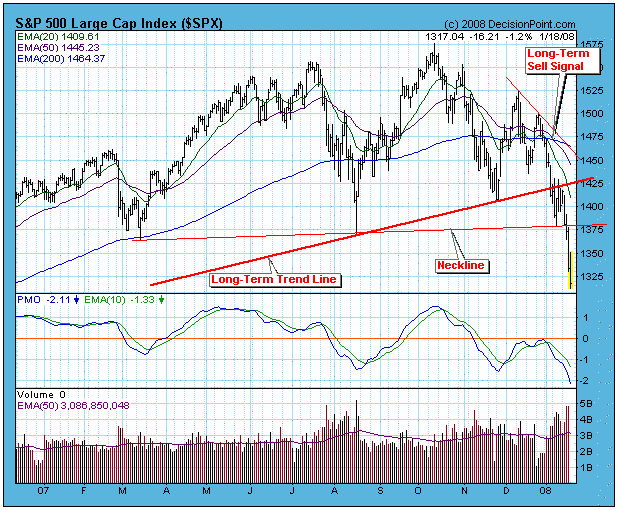
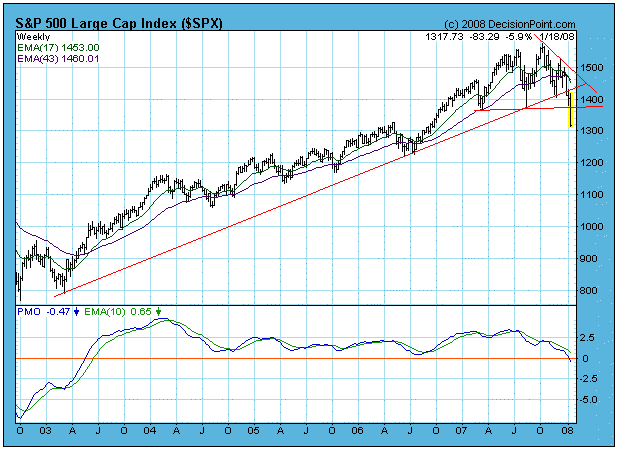
On January 8 the 50-EMA crossed down through the 200-EMA on the S&P 500 daily chart, generating a long-term sell signal and declaring that we are now in a bear market. This was confirmed this week when the weekly 17-EMA crossed down through the 43-EMA. Let me say that these signals are not 100% reliable, but there is a ton of additional supporting evidence, such as the decisive violation of the long-term rising trend line, and the violation of the double top neckline, seen on the chart below.
The next chart presents a long-term view, which makes it more clear how serious the situation is.
An important point is that this long-term sell signal is not so much an action signal as it is an information signal. What this means is that we need to begin interpreting charts and indicators in the context of a bear market template. For example:
- Oversold conditions should be viewed as extremely dangerous. Whereas in bull markets oversold lows usually present buying opportunities, in bear markets they can often resolve into more heavy selling.
- Overbought conditions in a bear market are most likely to signal that a trading top is at hand.
- While bear market rallies present great profit opportunities, long positions should be managed as short-term only.
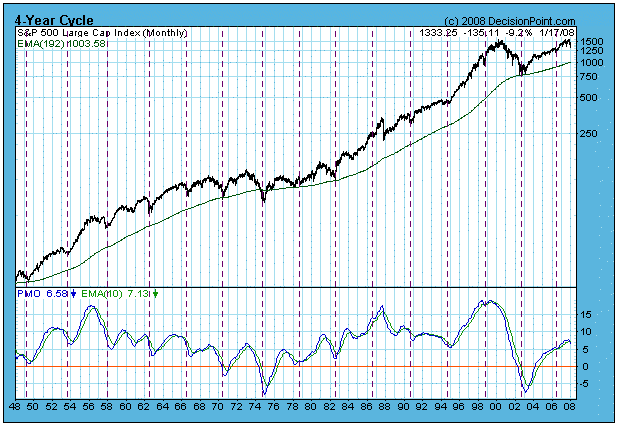
The questions remain as to how far down prices will go and how long the bear market will last? In the shorter term we have a minimum downside projection from the double top neckline of about 1160 on the S&P 500 Index. That could mark a medium-term low from which a bear market rally could rise. For the longer-term, let's look at the 4-Year Cycle chart below. As you can see, the last cycle low was in mid-2006, so the next projected low is in mid-2010. Assuming that the cycle low and bear market low will be the same, we have a long, bloody road ahead. The most obvious downside target is the support at the 2002 lows, about 750 on the S&P 500.
I think the basis for my conclusions is fairly easy to see and understand, but please keep in mind that these are educated guesses – somewhat better than wild guesses – and they are subject to radical revisions as reality unfolds. If it actually turns out that way, no one will be more surprised than I.
Bottom Line: Probability is very high that the bull market top arrived in October 2007 and that we are now in a bear market that will continue for another year or more, possibly until mid-2010. Until we have evidence to the contrary, remember that bear market rules apply. The next thing to expect is a reaction rally back toward the recently violated neckline support, which is now overhead resistence.


