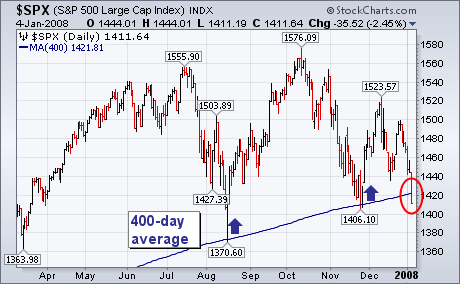
During the August market drop, I wrote about the importance of the 400-day moving average as a major support line. [That line is gotten by converting the 20-month moving average to a daily line. I'll show why we use that line shortly]. The daily bars in Chart 1 show the August and November price declines bouncing off that long term support line. The chart also shows, however, the S&P 500 closing below that support line today. [That's the first Friday close below that line in five years]. The 400-day line also resembles a "neckline" drawn below the August/November lows. That's another reason why today's breakdown could have bearish implications for the S&P 500 and the market as a whole. A close below the November intra-day low at 1406 would be further confirmation of today's moving average violation. Chart 2 shows why the 400-day line is important.