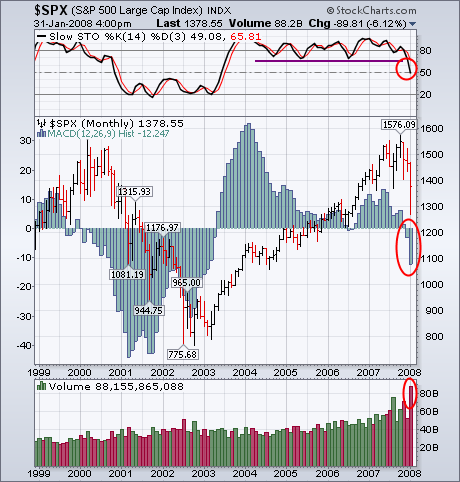
I haven't heard anyone in the media talking about the January Barometer, which is based on the view that "as January goes, so goes the year". That's probably because they only talk about it when the market has a strong January, which predicts a good year. Unfortunately, this January was a very bad one. The 6% loss in the S&P 500 makes it the sixth worst January on record. According to the Stock Trader's Almanac, "the January Barometer predicts the year's course with a .754 batting average. It goes on to state that "every down January on the S&P since 1950, without exception, preceded a new or extended bear market, or a flat market". In addition to a bearish January Barometer, the market had a bad chart month as well. The monthly bars in Chart 1 show the S&P 500 falling -6.12% since the start of 2008 on the heaviest volume in a decade. The monthly stochastic lines (above chart) have fallen to the lowest level since mid-2003. The monthly MACD histogram has been negative for two consecutive months.