Despite a big advance over the last few weeks, the Russell 2000 ETF (IWM) entered a resistance zone and has become overbought. There are two reasons to expect resistance around 72. First, the three February highs mark resistance in this area. Second, a 50% retracement of the December-January decline would extend to around 72. Corrective rallies normally retrace 38-62% of the prior decline. 50% marks the mid point and a good area to start expecting resistance.
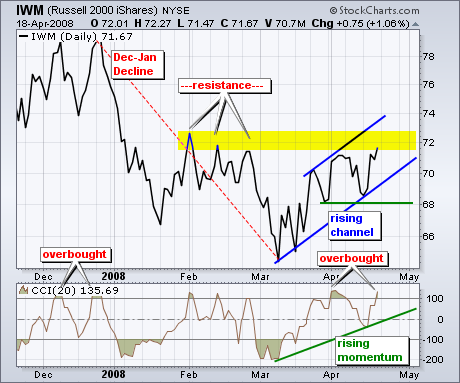
As far as oversold conditions, the Commodity Channel Index (CCI) moved above 100 for the second time this month. IWM remains both overbought AND strong as long as CCI holds above 100. I drew a trendline extending up from the March lows. A move below this trendline would signal trouble and a break into negative territory would be bearish for momentum.
Overall, a rising price channel is taking shape in IWM since mid March. As with the CCI indicator, this advance is in good shape as long as the lower trendline holds. I am marking key support at 68 from the late March and mid April lows. A move below the channel trendline and key support would reverse the uptrend that has been in place since mid March. Until such breaks, the bulls have the edge.


