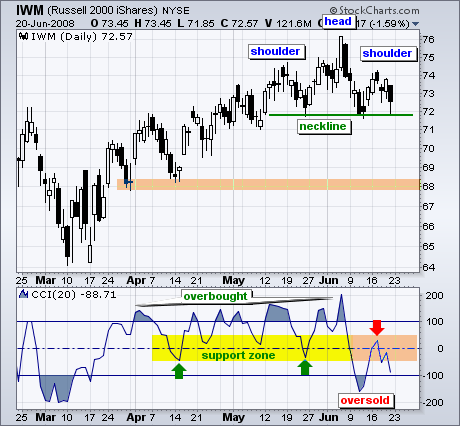
Despite a big decline in the S&P 500 ETF (SPY) over the last five weeks, the Russell 2000 ETF (IWM) has been holding up pretty well. However, a bearish reversal pattern and weakening momentum suggest that IWM will ultimately follow its big brother lower.
On the price chart, IWM formed a small head-and-shoulders pattern over the last six weeks. Neckline support resides just below 72 and a break below the June low would confirm this pattern. Once confirmed, the initial downside projection would be to around 68. The height of the pattern (roughly, 76 - 72) is subtracted from the neckline break for a target (72 - 4 = 68). There is also support around 68 from the late March and mid April lows.
Signs of weakness are starting to appear in the Commodity Channel Index (CCI). This indicator surged from oversold levels in early March to overbought levels in early April. This surge started the bull run. Notice that CCI never became oversold during the advance and dips below zero provided nice buying opportunities (green arrows). CCI declined to oversold levels in early June and this shows a reversal in momentum. Instead of support and buying opportunities around the zero line, we can now expect resistance and selling opportunities. Notice how CCI surged above zero, met resistance and then declined this week (red arrow).
There is also a videoversion of the this analysis available at TDTrader.com - Click Here.


