Even though techs and small-caps have been showing relative strength the last several weeks, the Nasdaq and the Russell 2000 are running into stiff resistance of their own. Their charts show similar setups that point to a medium-term peak.
First, let's look at the reasons for resistance. Both indices declined sharply from October to March and then rallied from mid March to early June. These rallies retraced 50-62% of the October-March declines and carried both indices back to their 200-day moving averages. In addition, broken support around 2550 turns into resistance for the Nasdaq. The yellow areas reflect these resistance zones on both charts.
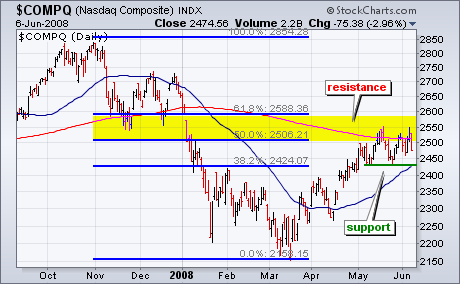
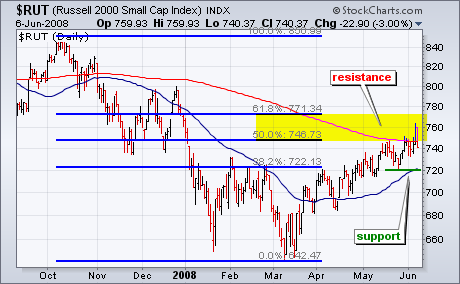
Friday's sharp decline reinforces these resistance zones and increases the chances of a trend reversal. Both indices have been moving higher since mid March and remain in 10-12 week uptrends. The late May lows and 50-day moving averages mark support for these uptrends. A break below these support levels would forge a lower low and reverse the uptrends.
There is also a videoversion of the this analysis available at TDTrader.com - Click Here.


