Tuesday afternoon marked a short-term bottom. In my opinion, we're going to print AT LEAST one more low in time; however, the sentiment had deteriorated on Tuesday to a point where we normally we see a rebound. In addition, there was TONS of net put premium (in-the-money put premium minus in-the-money call premium) and options were set to expire on Friday. We'll discuss sentiment issues shortly, but first take a look at the following closing prices on ETFs as of Tuesday and their respective max pain (the price point at which the premium on in-the-money call options equals the premium on in-the-money put options) prices:
DIA - closed on Tuesday at 109.30 and max pain was near 114.
SPY - closed on Tuesday at 120.99 and max pain was near 128.
QQQQ - closed on Tuesday at 44.24 and max pain was near 48.
XLF - closed on Tuesday at 17.17 and max pain was near 21.
I calculated the value of the net put premium on the QQQQ as of Tuesday and determined it to be approximately $250 million! That's just for one ETF. Imagine the amount of net put premium across all stock, ETF and index options. If the QQQQ's had continued to decline, the net put premium would have risen exponentially. In addition, there were over 1.825 million put option contracts traded on Tuesday, a record since the CBOE has been providing the equity only put call data. Simply put, the bears were a greedy bunch and the rubber band was stretched about as far as it was going to go near-term. As a result, there was a wicked rally on Wednesday and Thursday as prices gravitated much closer to max pain points. The max pain is a figure I calculate every month and it provides yet one more clue as to how the market might react near-term. This time, it was dead on.
Now back to sentiment. The equity put call ratio finished on Tuesday at .90 and the 5 day moving average of the equity only put call ratio had spiked to .88, the highest level since March 24th. In addition, the VIX spiked above 30. Readings above 30 on the VIX have coincided with recent market bottoms. In my last article, I discussed the lack of poor sentiment readings and indicated that we needed to see a step up in fear. We finally saw that on Tuesday. Now for the bad news. It wasn't fearful enough. The market was already primed to rebound off of oversold conditions, max pain issues and even a few recent positive divergences on intraday charts. That rebound materialized on Wednesday and Thursday. Take a look at Chart 1 below to review the VIX:
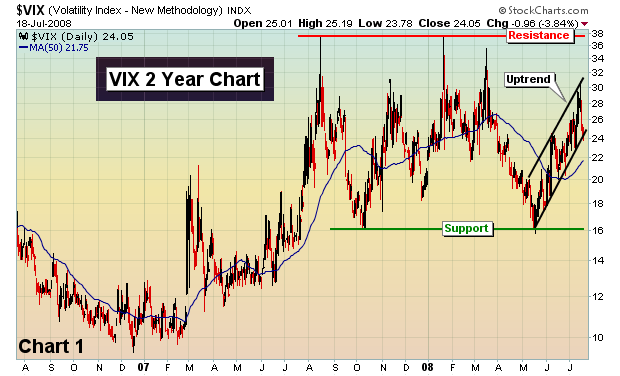
The resistance area on the VIX is above 35 - we have plenty of room to ramp up fear. The current uptrend may take us to that level before it breaks. Time will tell. Separately, while the put call ratio has been on the move to the upside and reflecting increased pessimism, it too has more room to go. Check out Chart 2:
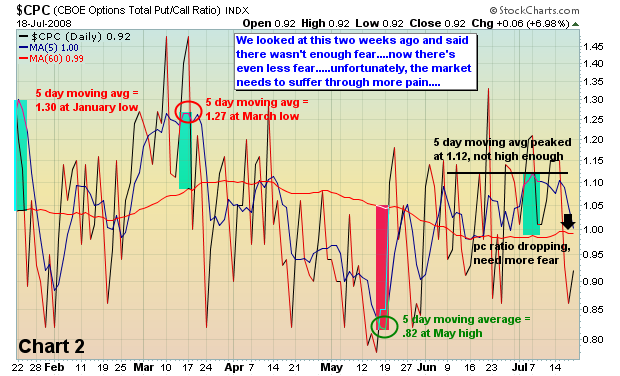
While we mentioned earlier that the "equity only" put call ratio approached the March fear levels, the total put call ratio as reflected in the above chart did not.
Historically, we entered on Friday the 2nd worst time period of the year. At Invested Central, we provide a historical perspective ("The Bowley Trend") on each trading day. For instance, consider the following data that relates to trading on the S&P 500 since 1950:
On July 18th, the S&P 500 has advanced 13 times, declined 29 times and has produced an annualized return of -46.48%
July 19th - 19 up days, 22 down days, -16.15%
July 20th - 19 up days, 23 down days, -20.76%
July 21st - 16 up days, 24 down days, -46.18%
July 22nd - 17 up days, 23 down days, -49.24%
July 23rd - 19 up days, 22 down days, -57.19%
Now for the NASDAQ since 1971:
July 18th - 9 up, 18 down, -91.68%
July 19th - 15 up, 13 down, -52.32%
July 20th - 14 up, 13 down, -17.81%
July 21st - 10 up, 16 down, -83.59%
July 22nd - 11 up, 14 down, -71.33%
July 23rd - 12 up, 13 down, -158.68%
July 24th - 12 up, 14 down, +1.49%
If the market advances over the next week, it will be doing it against significant historical headwinds.
Happy trading!


