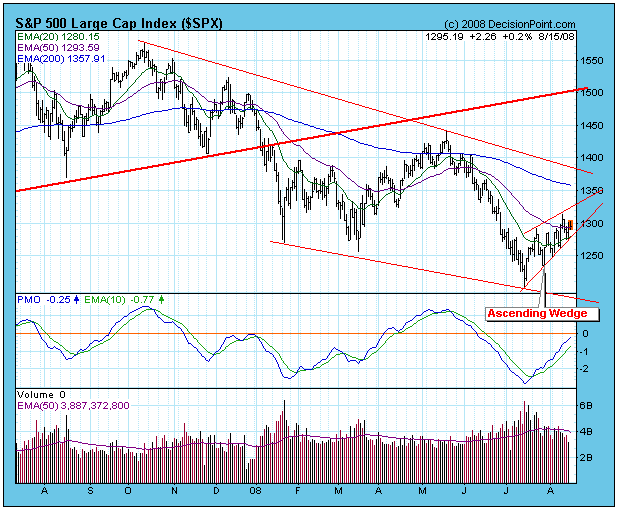
The rally that began off the July lows has not demonstrated the kind of strength we normally expect from the deeply oversold conditions that were present at its beginning. Instead, the meager price advance has served only relieve oversold compression and advance internal indicators to moderately overbought levels. In the process, as the chart shows, the price pattern has morphed into an ascending wedge formation, a bearish formation that usually breaks to the downside. Since we are in a bear market (the primary trend is down), odds of the negative outcome are increased.
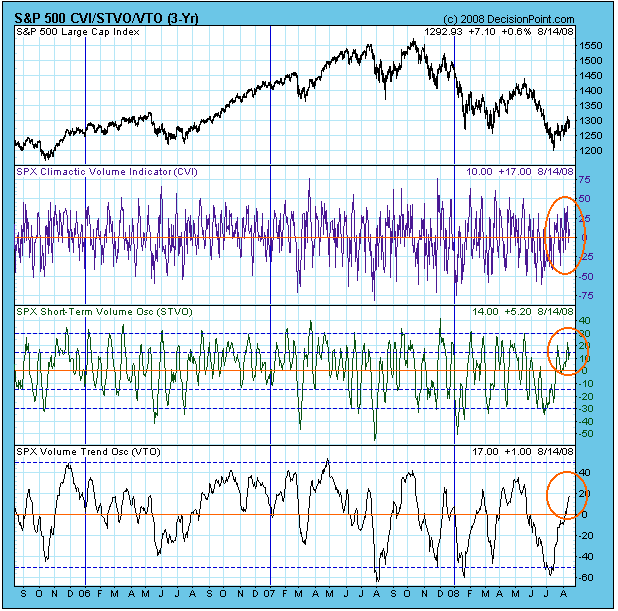
The next chart shows our On-Balance Volume (OBV) Indicator Set. The Climactic Volume Indicator (CVI) measures extreme OBV movement within the context of a short-term OBV envelope for each stock in the index. The Short-Term Volume Oscillator (STVO) is a 5-day moving average of the CVI. The Volume Trend Oscillator (VTO) summarizes rising and falling OBV trends. These charts tell us if the index is overbought or oversold based upon volume in three different time frames. All three are giving us useful information at present.
The CVI shows that upside volume climaxes have been quite mediocre, certainly well below the levels that we see when significant rallies are launched. The STVO and VTO show that the oversold conditions that existed at the July low have been cleared, and that the market is beginning to become overbought. With overbought internals and a bearish chart formation, we should be expecting a correction very soon.
A correction would not necessarily be a bad thing. The July low needs to be retested on a medium-term basis, and a successful retest would set up a broad double bottom, suitable to support a decent rally; however, in my estimation, prices will need to go a lot lower than they were in July before internals will be sufficiently oversold to fuel a healthy advance.
A bullish take on current conditions would emphasize that the subject ascending wedge is a short-term condition, and any downside resolution is likely to be short-term as well, meaning that a very short correction could result in a higher low that keeps the rising trend intact, albeit at a less accelerated angle. There could even be an upside breakout from the formation, but that is a long shot.
Bottom Line: While our trend-following model has us on an intermediate-term buy signal, my opinion is that we should expect a correction which, at the very least, will retest the July lows. Since we are in a bear market, there is also a strong possibility that any correction could be the start of the next leg down.


