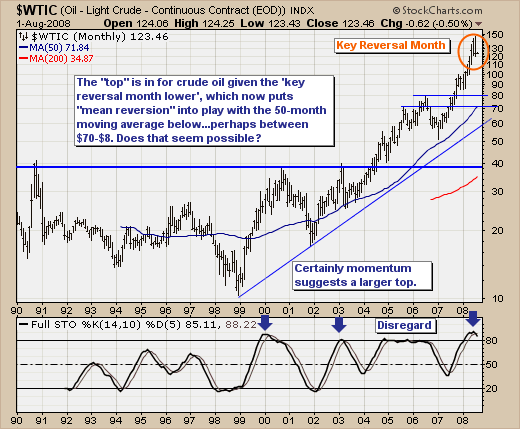
This past July-2008 was a very important month for the capital markets; crude oil peaked and traded lower by -11%. This is rather substantial to be sure, and one would be reasonable to believe that the demand/supply equation coupled with a daily technical oversold condition would push crude prices back higher. Perhaps it shall in the short-term, but we fear any and all rallies are going to be sold and sold rather aggressively to push prices towards $100/barrel by the November election. The reason as to the "why and how" it does so is left to the benefit of time.
We on the other hand, will note perhaps the most bearish of reversal patterns in crude oil - the "monthly key reversal lower." This simply denotes exhaustion of the previous trend as July saw new highs above June's, while new lows printed below June's lows as well...with prices closing virtually on their lows as well. We'll now argue that mean reversion is firmly in place, with a downside target of a meeting with the 50-month moving average currently near $70/barrel. Now given this is a monthly chart, it may take a great deal of time to get there - and perhaps the moving average does move higher to meet prices at some point. That is a question for the future; we are now concerned that crude oil prices are headed lower and what the impact shall be upon the broader stock market. Will it be positive as it "juices" the consumer; or is it part of the de-leveraging process that sends the broader market and all sectors lower? Good questions...and we'll explore those in the days and weeks ahead.


