Previously, I've mentioned a favorite indicator of mine - The Bowley Trend. The Bowley Trend is an analysis of stock market history, dating back to 1950 on the S&P 500 and 1971 on the NASDAQ. It identifies discernible bullish and bearish trends that have emerged over time and provides additional clues as to the direction of equity prices. I use The Bowley Trend to corroborate technical signals.
I mentioned in a July article the 2nd worst historical week of the year. We just experienced a major league beating during the absolute worst period. The most interesting aspect of October is that the worst historical period is followed immediately by the best historical period - amazingly, the bearish switch is turned off and the bullish switch is turned on, literally overnight. Consider the following annualized returns since 1971 on the NASDAQ:
October 22: 15 up days, 11 down days, annualized return -64.98%
October 23: 8 up days, 16 down days, annualized return -89.82%
October 24: 11 up days, 16 down days, annualized return -66.26%
October 25: 9 up days, 19 down days, annualized return -66.85%
October 26: 12 up days, 15 down days, annualized return -110.15%
October 27: 11 up days, 15 down days, annualized return -110.28%
Pretty darn bearish, I'd say. Now consider these bullish numbers from a period that immediately follows the above bearish period:
October 28: 17 up days, 8 down days, annualized return +132.02%
October 29: 16 up days, 10 down days, annualized return +68.14%
October 30: 13 up days, 13 down days, annualized return +46.85%
October 31: 17 up days, 9 down days, annualized return +105.77%
November 1: 16 up days, 12 down days, annualized return +62.41%
November 2: 16 up days, 9 down days, annualized return +144.07%
November 3: 16 up days, 10 down days, annualized return +84.13%
November 4: 15 up days, 9 down days, annualized return +54.94%
November 5: 21 up days, 5 down days, annualized return +153.46%
November 6: 15 up days, 11 down days, annualized return +43.91%
Quite a reversal, huh? This historical tendency was a contributing factor for Invested Central turning bullish on Monday, October 27th. The Bowley Trend shorts indices during bearish historical periods, goes long indices during historical bullish periods and remains 100% in cash during neutral periods - neutral periods are defined as periods where there are no discernible trends. During October alone, The Bowley Trend posted an incredible 27.44% return, over 45 percentage points higher than the actual negative return of 17.73%. Perfectly on cue, the major indices reversed course at the close on October 27th. Folks, I don't make this stuff up, I just report the facts. It is periods like these that has enabled The Bowley Trend to nearly triple the "buy and hold" returns of the NASDAQ since 1971. And it's as simple as following a calendar - the dates do not change. It's also why we provide this indicator to our members each day, it's that important.
Technically, the market is recovery mode. We've got a long way to go and the depths of this recession will be great. I've identified near-term support and resistance for the Dow Jones on the following chart:
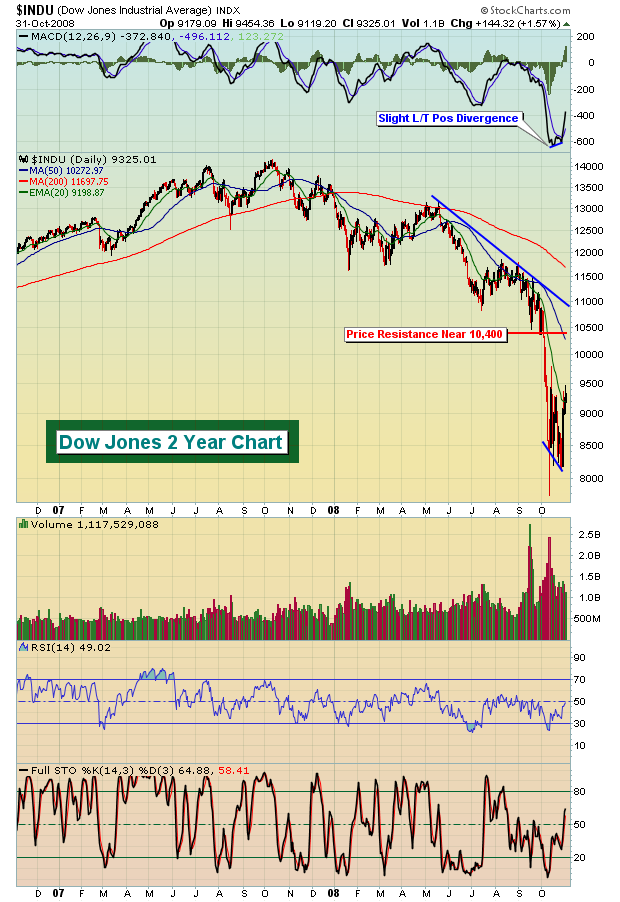
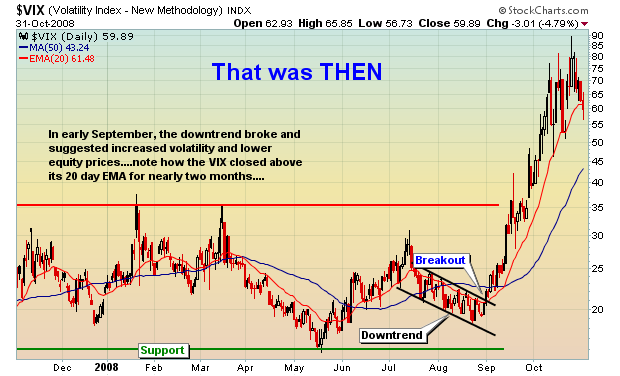
From the above chart, I've identified a key price resistance level on the Dow Jones near 10,400. I believe the current range on the Dow is from 7800-10400 and that's where we'll trade. Should the Dow approach that resistance on lessening volume, be very cautious, and possibly consider shorting if you have a propensity to short. The volatility index, or VIX, is finally taking a breather. Take a look at the two VIX charts below. The first shows where we were in early September and my analysis then vs. where the VIX stands now and what it's signaling.
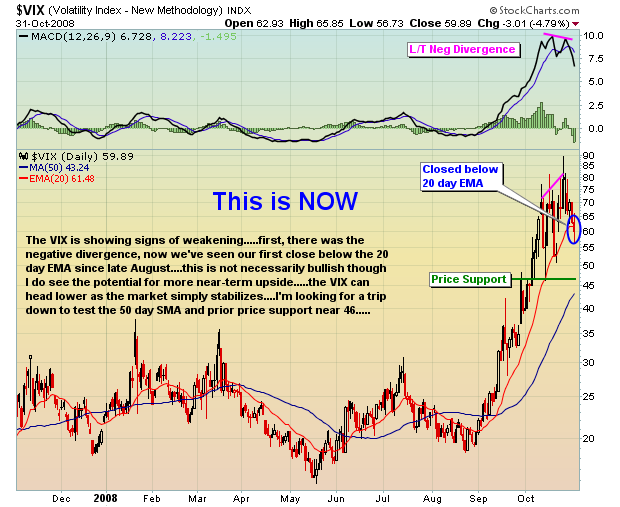
Expect volatility to remain high, but lessening from the ridiculous levels over the past several weeks. Traders will need to remain on their toes, capturing profits when available and keeping appropriate stops in place to avoid big losses.
Happy trading!


