Hello Fellow ChartWatchers!
Happy Holidays and welcome to our December issue of ChartWatchers. We only do one newsletter in December and so you can bet it's a good one. John, Arthur, Carl, Richard and Tom are all focused on the market but I wanted to take time today to make sure that everyone is getting the most out of one of the key features of our website: ChartStyles.
ChartStyles are basically "templates" of charts. They contain everything about the chart except the ticker symbol. Members of our Basic and Extra services can save multiple ChartStyles into their accounts for quick access later. Consider the following example:
Let's say that you have been reading the newspaper and a story on Amazon (ticker symbol: AMZN) catches your eye. You'd like to do some research on AMZN's price movements - what's the best way to start?
Step One is to just go to StockCharts.com, enter AMZN in the Quick Chart box and click "Go!". That will give you a SharpChart of AMZN in your "Default" ChartStyle for your account. If you've never changed your Default style, you'll see a daily candlestock chart with RSI and MACD indicators.
While your Default chart is helpful, you'll want to do more in-depth research. Let's say that you also want to see the long-term view, the short-term view, a trending-or-oscillating study, and maybe a Renko study.
While you can change the settings below the chart to create each of these things, that gets tedious after awhile. There has to be a better way, right? That "better way" are ChartStyles. By taking the time to create and save each one of those different studies into your account as a ChartStyle, you can then pull up those settings instantly with just one or two clicks.
For example, here are the steps to create and save a "trending-or-oscillating study" as a ChartStyle:
Step 1 - Create a Chart with the Settings you Want
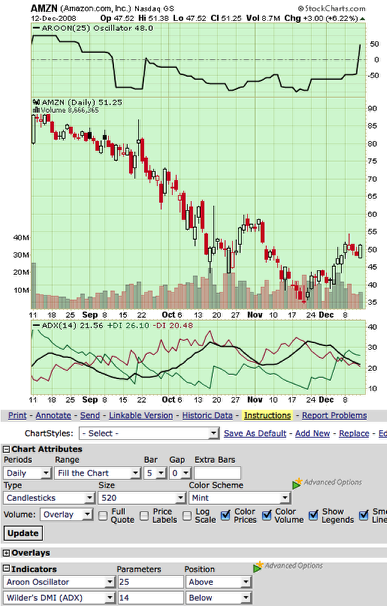
In this case, I added the Aroon Oscillator and Wilder's ADX studies to a standard candlestick chart. Both indicators can help you determine if a stock is "trending" or "trading" (i.e. oscillating sideways) which is very useful in determining which buy/sell signals to use. (See our ChartSchool articles on those indicators for more info.)
Step 2 - Make Sure your Settings are "General Purpose"
Before saving a ChartStyle you want to take a moment and review your settings to ensure that they will work with other ticker symbols at other times. Specifically, you want to avoid using "Start/End" Range settings that have specific dates in them - those dates may not be valid when you use this ChartStyle several months from now. You also want to avoid using Price indicators that include the chart's main ticker symbol - those settings won't make sense when you apply this style to a different ticker.
Step 3 - Add the New ChartStyle to Your Account
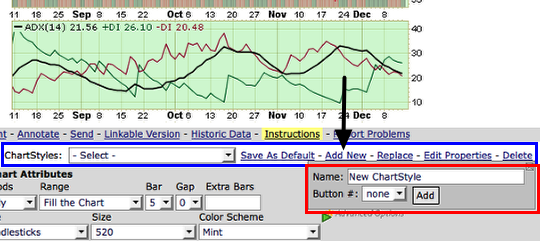
Just below the chart is the "ChartStyle" line - I've outlined it in blue in the picture above. It contains all of the links you need to create and control your ChartStyles. Right now, we are trying to add a new ChartStyle to our account, so we need to click the "Add New" link (the black arrow). When we click that link, a popup area appears below it - that's what I've outlined in red above.
Let's call our new ChartStyle "Trend/Oscillate Study" - simply enter that in the "Name" field and click the "Add" button to create the new ChartStyle. (I'll talk about the "Button" field in my next article.)
Step 4 - Test the New ChartStyle
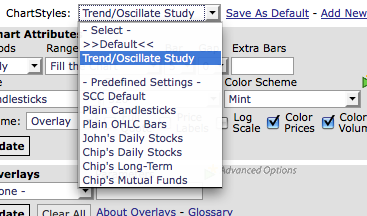
We can use the "ChartStyles" dropdown to test our new style. It contains all of our saved ChartStyles as well as our ">>Default<<" style and seven predefined styles. To test our new style, first select the "SCC Default" setting from the dropdown. You should see the standard RSI/MACD chart appear. Then select "Trend/Oscillate Study" and our Aroon/ADX chart should reappear. Success!
You can now apply that study to ANY ticker symbol just by selecting that entry from the ChartStyles dropdown. I bet you can think of 10 more studies that you'd like to create. Why wait? Go for it. Every ChartStyle you create makes StockCharts that much more powerful for you. Enjoy!
If you get confused by any of this, click the yellow "Instructions" link for more information.
Happy Holidays everybody!
-- Chip


