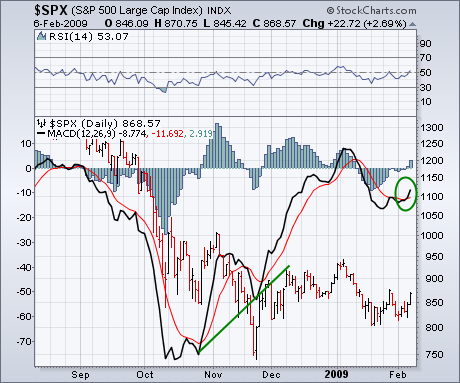
A reader complained this week that we failed to point out the "negative divergence" in the daily MACD lines during January prior to the latest downturn. The reason I didn't point it out was because none existed. In fact, it may be the other way around. At the moment, the daily MACD lines look more positive than negative. Chart 1 overlays the MACD lines (and MACD histogram) over daily bars for the S&P 500. The chart shows that the MACD lines bottomed during October and gave a positive divergence during November (rising trendline) before rallying into the start of January. No negative divergence was given at the early January top. Although the S&P fell to the lowest level in two months during January, the MACD lines remained well above their earlier lows. The lines have now turned positive again (see circle). To me, that looks like positive divergence and hints at more market strength. The market is rallying today with the biggest gains coming from financial stocks (and banks in particular). The S&P is up more than 2% and is nearing a test of last week's intra-day high at 877. A close through that initial chart barrier would strengthen the market's "short-term" trend and keep the three-month trading range intact. There's even more good news.

