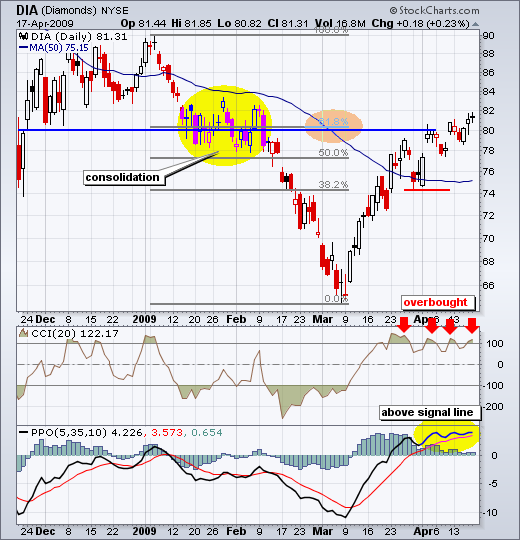
The Dow Industrials ETF (DIA) shows a classic case of becoming overbought and remaining overbought. I featured DIA in ChartWatchers two weeks ago as it hit potential resistance around 80. The song remains the same as DIA finished at 81.31 on Friday.
Let's review resistance. First, the middle of the prior consolidation (yellow area) marks resistance in the lows 80s. Second, the Mar-Apr advance retraced around 62% of the Jan-Mar decline. In addition to resistance, the Commodity Channel Index (CCI) moved above 100 (overbought) for the fourth time in the last four weeks. Even though overbought conditions and resistance argue for a pullback, DIA refuses to cooperate with the bears right now.
This calls for another indicator that is more sensitive to the actual trend, which is clearly up. Enter the Percentage Price Oscillator (PPO). As the difference between two moving averages, the Percentage Price Oscillator (PPO) is a rare breed that offers the best of both worlds: a little trend and a little momentum. Moving averages measure trend, while oscillators measure momentum.
The bottom window shows the Percentage Price Oscillator (5,35,10) with its 10-day EMA (red signal line). Even though the indicator flatted over the last three weeks, it never broke below its signal line. The histogram shows the difference between the indicator and the signal line. While upside momentum may be waning, DIA is still edging higher and I will be watching the Percentage Price Oscillator (PPO) for break below its signal line that could signal the start of a correction. Expect DIA to continue higher as long as the Percentage Price Oscillator holds above its signal line.

