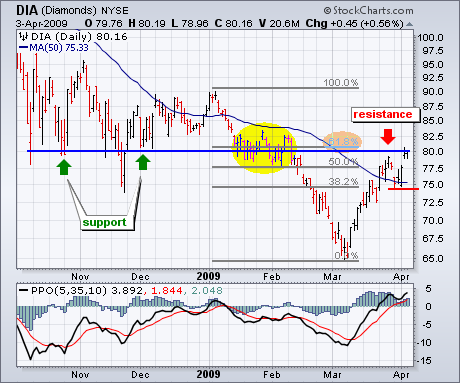
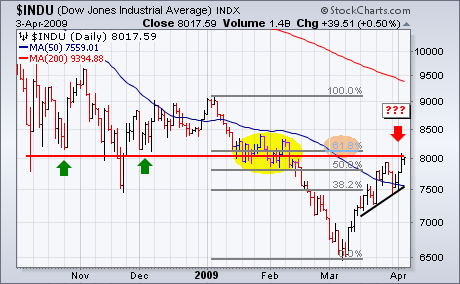
The Dow Industrials ETF (DIA) surged off its 50-day moving average with a big advance on Wednesday and a gap on Thursday. While the four-week surge is most impressive, the ETF is running into a resistance zone and becoming overbought. First, broken supports around 80 turn into resistance. This level is equivalent to 8000 on the Dow. Second, DIA retraced 62% of the prior decline and this key retracement can act as resistance. Third, the consolidation from late January to early February also acts as resistance (yellow area). Finally, DIA has advanced four weeks straight and is now up 23% since early March. This makes it overbought by most yardsticks. While securities can become overbought and remain overbought in strong uptrends, the chances of a correction are increasing. The bottom indicator shows the Percentage Price Oscillator (5,35,9), The bulls are in good shape as long as this indicator rises and remains above its signal line. A dip below the signal line could signal the start of a correction.


