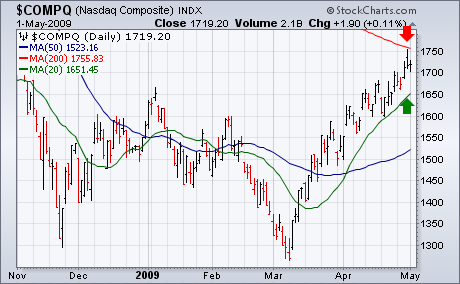
One of the problems with doing an analysis of the "stock market" is choosing which market index to represent it. Like most analysts, I rely on the S&P 500 which is generally viewed as the market benchmark. As we've pointed out several times, however, some parts of the market have been rallying much stronger than others. One of those groups is technology which is heavily represented in the Nasdaq market. Generally speaking, relative strength by technology and the Nasdaq are good signs for the rest of market. And the fact that the Nasdaq Composite has already exceeded its January high is a definite sign of leadership. However, the Nasdaq is undergoing another test of its uptrend. Chart 5 shows the Nasdaq Composite Index testing its 200-day moving average near 1750. It's a good idea to keep an eye on that test. It's also a good idea to watch the rising 20-day average (green line). The Nasdaq needs to stay above that rising support line to keep its uptrend intact.


