This is the seventh part of a series of articles about Technical Analysis from a new course we're developing. If you are new to charting, these articles will give you the "big picture" behind the charts on our site. if you are an "old hand", these articles will help ensure you haven't "strayed too far" from the basics. Enjoy!
(Click here to see the beginning of this series.)
Chart Analysis - Support and Resistance
Prices are driven by two of humanity's strongest emotions: Fear and Greed. When more investors are fearful that a stock will fall, it does! It will continue to decline until the balance between Fear and Greed is re-established. The same is true for greed and rising prices. This phenomenon is referred to as "Market Psychology."
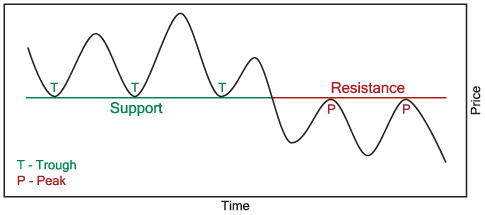
Support is the price level where "greedy" buyers enter the market to prevent prices from declining further. Support can develop at a specific price or more commonly in a price zone. Areas of support can exist for many months at a time.

The diagram above illustrates how market psychology causes the previous area of price support to turn into resistance. After breaking support, traders who bought in the zone of support are now holding losses and want to sell as soon as prices approach their original purchase prices in order to break even.
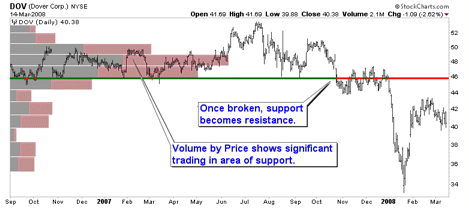
The Volume by Price overlay (volume traded in incremental price ranges) in the following SharpChart of Dover Corp illustrates how strong support at 46 later became significant resistance as greed turned into fear.
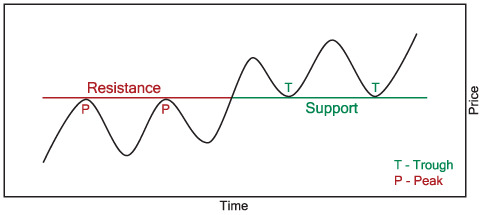
The concept of resistance is opposite of the support as discussed above. Resistance is the price level where "fearful" sellers suddenly come into the market and prevent prices from advancing further. Like support, resistance can develop at a specific price or in a price zone and can be held for months at a time.

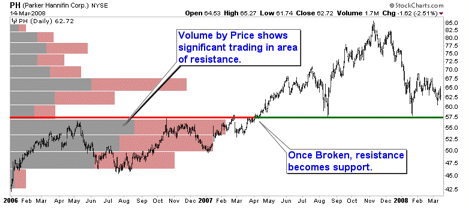
If resistance is broken, market psychology causes the previous area of price resistance to turn into support. The diagram above illustrates this market behavior. Stock holders who sold in the zone of resistance are now regretting selling and want to buy as soon as prices approach the level they sold at earlier. Prices that seemed too high before now look like a bargain. The following SharpChart of Parker Hannifin Corp. illustrates resistance later becoming support. Notice how Volume by Price indicates the potential number of previous sellers willing to buy again if given the opportunity.
Next time we'll discuss trendline analysis and trend channels.


