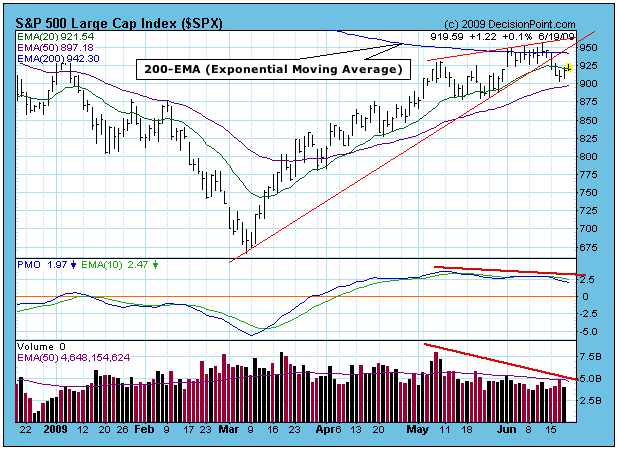
On Monday, in predictable fashion, prices broke down from the ascending wedge pattern we've been watching. Then, after a correction of 5%, prices began a snapback move up toward the recently violated support line (now overhead resistance). Prior to the breakdown, you will notice that overhead resistance was presented by the 200-EMA (exponential moving average), which also happens to coincide with the top of the wedge pattern. Once the snapback is completed, I am inclined to expect the correction to continue for a while. There is good support at 880, and after that the most obvious support is around 670.
As I mentioned last week, medium-term negative divergences are beginning to appear -- the PMO and fading volume on the chart below are two examples. Also, we are in the six-month period of negative seasonality, which will last through October. The mini-bull market has had quite a nice run, but, since we are still in a secular bear market, we should consider that perhaps prices are starting to roll over in order for the bear market to resume.
To change the subject, now seems like a good time to address the differences between the simple moving average (SMA) and the exponential moving average (EMA). A 200-SMA is the average of the last 200 days closing prices. To calculate today's 200-SMA, you drop the first price in the series (200 days ago), add today's closing price, then divide by 200. As you can see, the price 200 days ago has the same weight as today's close.
The EMA is weighted almost totally toward recent activity. To calculate a 200-EMA you begin with yesterday's EMA, subtract 1/200th of that number, and add 1/200th of today's closing price. (Math wonks will probably take issue, but it's close enough to help grasp the concept.) With the EMA we will not have a large move that happened 200 days ago affecting today's EMA.
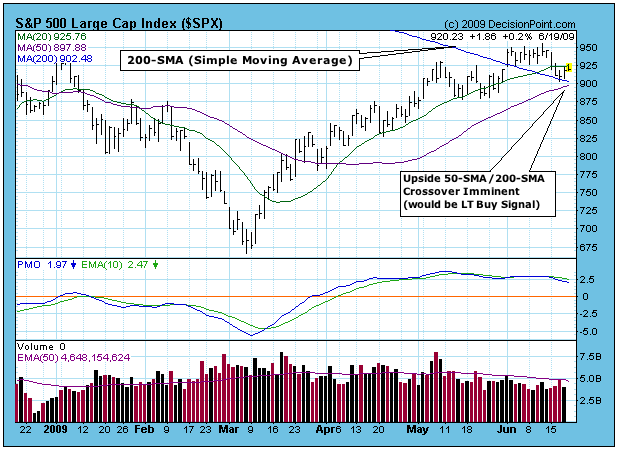
The reason I am discussing this issue is to demonstrate how EMAs and SMAs can present completely different pictures. On the chart above, which uses EMAs, you can see how the 200-EMA appears to have stopped the forward progress of the S&P 500. There is also a substantial gap between the 50-EMA and the 200-EMA. (A 50/200-EMA upside crossover would generate a long-term buy signal.) On the chart below, which uses SMAs, the S&P 500 has broken above the 200-SMA, and the 50-SMA is about to break up through the 200-EMA (long-term buy signal).
Obviously, the SMAs present a positive picture versus an ongoing negative picture presented by EMAs, and such divergences are fairly common. So which one are you going to believe? I don't know how this will ultimately resolve, but I believe and will act upon the EMAs. I have always preferred EMAs because they do not give much weight to old numbers, but others prefer SMAs. In any case, you should use one or the other and stick with it.
Bottom Line: The ascending wedge formation resolved downward, and after a small decline, a reaction rally (snapback) has taken place. While downside resolution of this formation has only short-term implications, it is my opinion that medium-term correction has begun.


