I've been bullish for several weeks now, but the tide is changing. We are running out of historical bullish periods until later in 2009. We have a few periods that are a bit more optimistic, but by and large the stock market remains either neutral or bearish through the remainder of the summer from a historical standpoint. I've discussed previously the tendency for the stock market to perform well early in May, then again late in May. The same generally holds true for June, as historical bullishness falls mostly in the early and latter parts of the month.
It's not just seasonality that has me cautious though. There have been an increasing number of bearish signals forming in the market over the past few weeks and I've communicated those one by one to our members. Volume trends have generally remained strong across all of the major indices and that's helped keep a bid under the market. But mixed signals have slowed down the number of alerts we've been willing to play. The keys to successful trading in the stock market begins with determining the highest probability of market direction. During periods of mixed signals and consolidation, risk should be minimized via fewer trades or smaller positions. Many traders struggle simply because they don't adapt their trading strategy to the market at hand.
Technical analysis provides the clues necessary to navigate the market. Sectors that outperform the S&P 500 should produce the majority of individual stocks traded. Too many times stocks are bought without regard to their industry and technical analysis. Instead, traders chase stocks, buying after a significant move has already been made. The absolute best time to buy a stock - in my opinion - is after it's pulled back in an uptrend to key support. In an uptrending market with solid divergences, the 20 day EMA test is normally a great place to enter. That was the focus of our trading during late March, throughout April, and into early May. When divergences turn negative, however, it's best to avoid stocks until they at least reach their respective 50 day SMA.
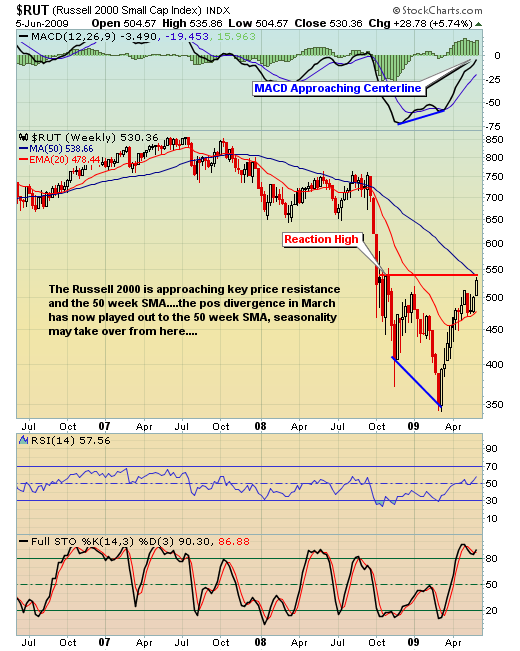
Let's take a look at the Russell 2000 index, a barometer of small cap stocks. These stocks tend to perform poorly in June, outside of the first few days and the last few days of the month.
As you can see, the divergences are weak and key resistance areas are upon us. While the market may surprise me and continue rolling here, I suspect we're at or near a fairly significant short-term top. In fact, I'm concerned about the overall market. I've spoken for the last several weeks about the underlying bullish technicals. I'm seeing a lot more warning signs now. If interested, click here for a video presentation that details the various warning signs.
Happy trading!

