Last week I presented an alternate scenario to the head and shoulders breakdown and projected decline:
"While the bearish case seems strongest at this point, a bullish outcome is not impossible. Bullish forces have weakened, but it is not at all clear that the bear market has resumed. A more positive analysis of the situation could be that there has been a two-month rally from the March lows, followed by a two-month correction/consolidation. The neckline violation could be the end of the correction and a bear trap. I present this outcome because I have seen it happen before, and it is not yet out of reach; however, I don't think it is likely."
Well, I didn't think it was likely, but that is what happened. I don't feel too bad about that because our Thrust/Trend Model is still on a medium-term buy signal, proving once again that the timing model is smarter than I am. But being wrong can also impart useful information. Since the bearish formation ultimately resolved in a bullish direction, we can assume that bullish forces are in command, and that the rally will continue.
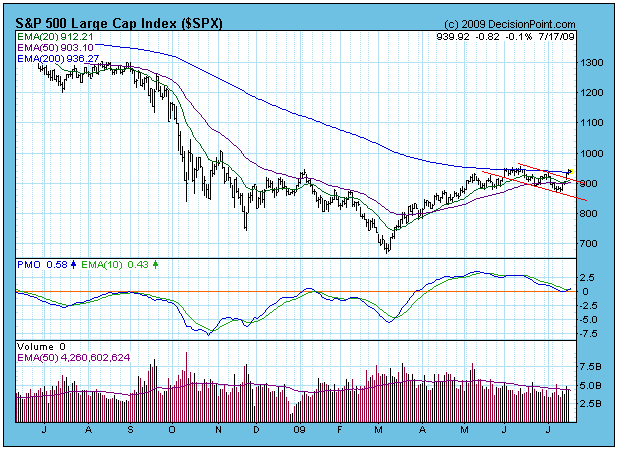
So now, with the head and shoulders pattern having evaporated, we need to attempt to apply another context to the price pattern. The most obvious at this point is that the decline from the June top was a correction/consolidation for the advance off the March lows. I have drawn lines to define the top and bottom of the declining trend channel, which looks a lot like a flag formation hung on a lazy flag pole. There has been a strong breakout above the top of the channel.
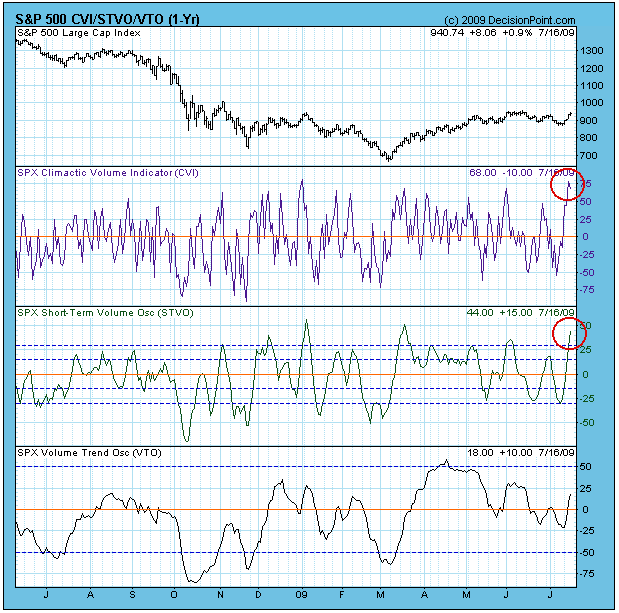
The concern at this point, "Is the breakout really just a blowoff?" The June top has not yet been exceeded, volume on the breakout was unimpressive, and short-term indicators are very overbought. Below is a chart of the CVI (Climactic Volume Indicator) and STVO (Short-Term Volume Oscillator). Both have reached climactic levels, but as usual we are left to decide if it is an initiation climax or an exhaustion climax (blowoff). My opinion is that it is an initiation climax, because it has occurred after a price consolidation, rather than at the top of an advance. Also, most medium-term indicators are not overbought.
Using flag pole as a measuring stick, I estimate a possible upside price target of 1200. Assuming that price is in the ball park, our long-term model, which is still bearish, will be switching to bullish very soon. Until then, I will still assume that the long-term is bearish, but I thought it worthwhile to point out that we are nearing a tipping point.
Bottom Line: The violation of the head and shoulders neckline has proven to be a bear trap, and my opinion is that the rally from the March lows is resuming. My upside price target is about 1200 on the S&P 500. I have to say that this doesn't make any sense considering what I think I know about the economy, which is why I try to ignore fundamentals in favor of the charts.


