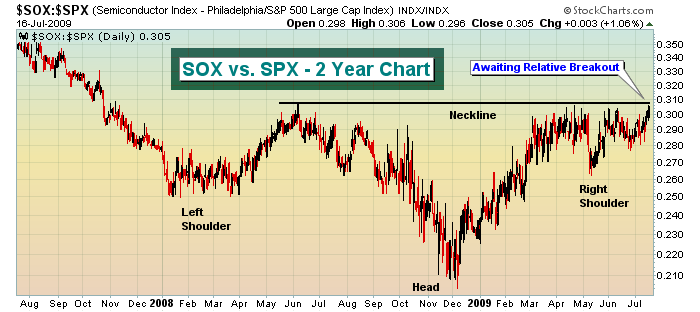
This first chart really says it all:

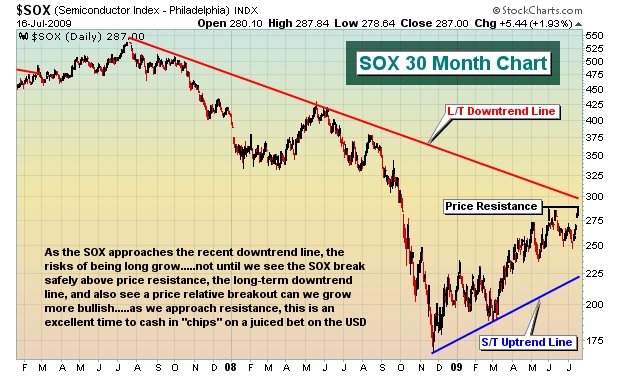
Semiconductors are trying to break out on a relative basis. They're trying to do it at a time when the major indices are attempting breakouts of their own. A combination of a relative price breakout in semiconductors while at the same time breaking out across our major indices would be very bullish for equities, arguing for much higher prices. Will the breakouts occur? Tough question. We'll need a catalyst. Intel Corp (INTC) provided the boost necessary to jumpstart the SOX and send it to test previous highs. The chart below shows us the nice price action in the semiconductor group over the past several trading sessions:

The USD tracks the Dow Jones U.S. Semiconductor Index (DJUSSC) at a 200% clip. The DJUSSC was up 16.74% from the low on July 8th to the high on July 16th. The USD, designed to double those returns, posted gains of 35.69%. That was actually slightly more than double. It's the beauty of compounding returns. Anytime you can identify a trend in an index, playing that trend with juiced ETFs makes perfect sense so long as you understand the leveraging nature of the beast. When underlying indexes are in trendless periods, moving back and forth, these juiced ETFs are DEADLY. The only time you want to hold juiced ETFs is when the trend is moving in the direction you're looking for. When the trend stops, you must move to the sidelines.
On Wednesday, July 22nd, at 4:30pm EST, my partner John Hopkins and I will be having a LIVE webinar specifically designed to uncover the secrets of successfully trading juiced ETFs. It is a FREE webinar. We'll spend plenty of time detailing when you want in and when you want out of these highly volatile ETFs. The longer you hold, the more "slippage" you'll experience as the juiced ETFs are specifically designed to follow at a 200% clip so long as a trend is in place. Once the trend changes, all bets are off. If you'd like to register for this FREE event, click here.
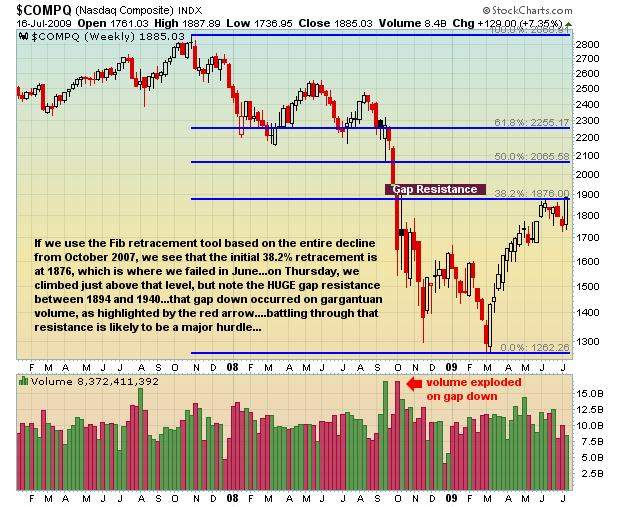
The bulls have been in charge since the March lows. Specifically, the NASDAQ has barely cleared a key 38.2% Fibonacci retracement level from the October 2007 high down to the March 2009 low and is now approaching significant gap and price resistance levels as illustrated below:

It is going to be very interesting to see whether the bulls can maintain control of the market as we enter into the worst period of the year historically (mid-July through late September).
Happy trading!


