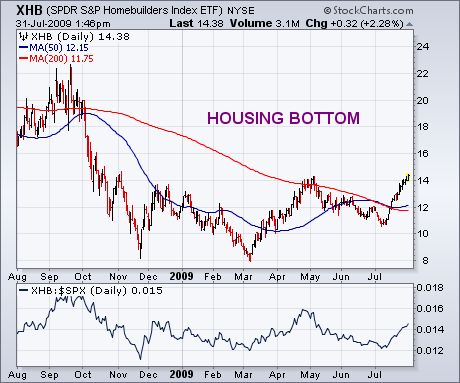
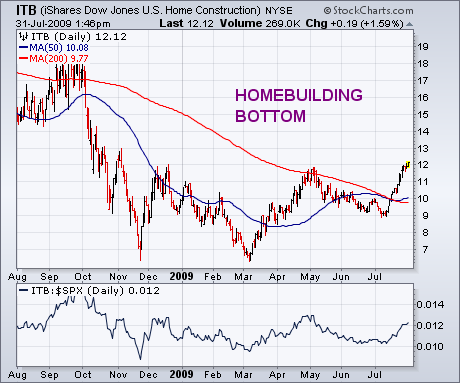
On Monday, I wrote a bullish message on the homebuilding group and suggested using the SPDR S&P Homebuilding ETF (XHB) as one way to participate in the housing recovery. I pointed out, however, that the XHB has a relatively heavy weighting in a lot of housing-related stocks that aren't necessarily homebuilders (like Home Depot, Bed Bath & Beyond, Masco, etc.). A purer homebuilding play can be found in another ETF -- iShares Dow Jones U.S. Home Construction (ITB) -- which is shown in Chart 2. The two charts are basically similar, show the same bottoming characteristics since last November, and are both on the verge of breaking out to the highest levels in nine months. On percentage grounds, however, the ITB has an edge. Since the start of 2009, the ITB has gained 23% versus 19% for the XHB (the S&P 500 has gained 9%). Since the March bottom, the ITB has rallied 87% versus 74% for the XHB (and 44% for the S&P 500). The top holdings in the ITB are homebuilders like NVR, DR Horton, PHM, Toll Brothers, Lennar, and Centex. The XHB offers participation in a broader array of housing-related stocks. If you want a purer homebuilding play, however, ITB would be the better choice.


