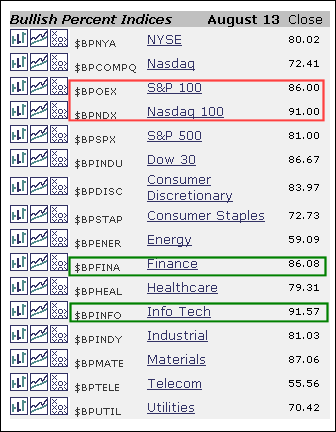
The Bullish Percent Indices measure the percentage of stocks on a Point&Figure buy signal for a given index. In general, an index has a bullish bias when its Bullish Percent is above 50% and a bearish bias when below 50%. Stockcharts.com users can easily keep an eye on the bullish percent indices in the Market Summary page. In fact, the table below comes directly from the bottom of the Market Summary page. The major indices are at the top, followed by the sectors.
As you can see, the Bullish Percents are above 70% for all the major indices. No sign of weakness here. Of the ten sectors, six have Bullish Percents greater than 79%. This is a sign of broad strength. Of the remaining four sectors, two are in the low 70s, energy is around 59% and telecom is around 55%. Using bullish percent to measure relative strength, energy and telecom are the least strong sectors right now. Of the major indices, the Nasdaq 100 and S&P 100 are the strongest (large-cap and large-cap technology). The bulls are in good shape as long as the majority of these Bullish Percents holds above 50%. You can read more on Bullish Percent in the Chart School.


