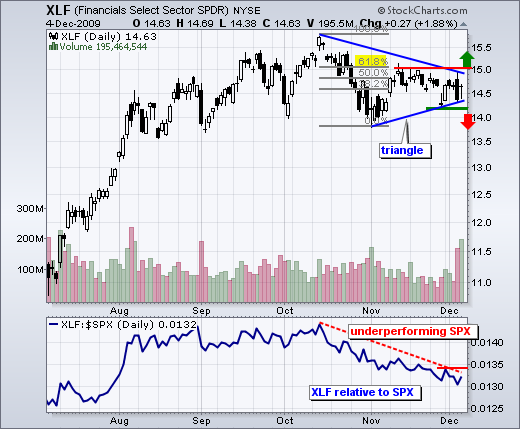
The finance sector continues to underperform the overall market. While the S&P 500 and Dow are consolidating near 52-week highs, the Financials SPDR (XLF) remains well below its October high and shows relative weakness. The bottom indicator contains the price relative, which is the XLF:$SPX ratio. XLF is outperforming when the ratio rises and underperforming when the ratio falls. Notice that the ratio peaked in October and declined to its lowest levels since late July. XLF is clearly underperforming the S&P 500.
 Click this chart for details.
On the price chart, XLF formed a triangle consolidation over the last eight weeks. Prior to this triangle, the ETF advanced from July to October. While this triangle can be considered a consolidation within an uptrend, the next signal is dependent on the triangle resolution. A break above 15 would be bullish, while a break below 14.2 would be bearish. The market is likely to follow in the direction of this triangle break.

About the author:
Arthur Hill, CMT, is the Chief Technical Strategist at TrendInvestorPro.com. Focusing predominantly on US equities and ETFs, his systematic approach of identifying trend, finding signals within the trend, and setting key price levels has made him an esteemed market technician. Arthur has written articles for numerous financial publications including Barrons and Stocks & Commodities Magazine. In addition to his Chartered Market Technician (CMT) designation, he holds an MBA from the Cass Business School at City University in London.
Learn More


