Hello Fellow ChartWatchers!
I am thrilled to officially announce that StockCharts.com now provides free real-time charts and quotes for everyone!
Thanks to the BATS exchange and the fine folks at IDC/Comstock, our free users and our Basic and Extra members are now able to see charts based on non-delayed price data during market hours. The data comes directly from the BATS exchange and we highlight it in yellow on our charts.
While that change is very exciting, it is important to keep in mind several differences between real-time data from BATS and the "official" real-time data from the NYSE, Nasdaq and TSX exchanges (which our "ExtraRT" subscribers see). Those differences include:
- The "real real-time" data that ExtraRT subscribers see comes directly from the NYSE, Nasdaq, or TSX stock exchanges. It is the "official" data for a particular stock. If you place a typical trade order with your broker, they will execute the trade using those prices.
- The "free real-time" data that appears on our non-ExtraRT charts comes from the BATS exchange. The data is often very similar to the "official" data from the major exchanges, but there can be small differences in prices. The volume information that the BATS exchange provides is much, much lower than the volume data from the major exchanges.
- Because "free real-time" data is different from the "official" data, we highlight it in yellow on our charts. Real real-time data is highlighted in green.
- We only display "free real-time" data for 20 minutes on our charts, After that, we replace the "free real-time" bar(s) with delayed "official" bars from the major exchanges. For 1-minute and 5-minute charts, we place a vertical, dashed yellow line on the chart to show where the free real-time bars end and the official bars begin.
- We do not display volume information with the free real-time bars because the volume data from the BATS exchange is so much smaller than the official volume data. We also do not display any volume-based indicators in the "free real-time" section of the chart.
- Not all stocks that we track have free real-time data available for them. There is no free real-time data currently available for Canadian stocks or for Pink Sheet stocks. Other thinly traded stocks will probably also not have BATS data either.
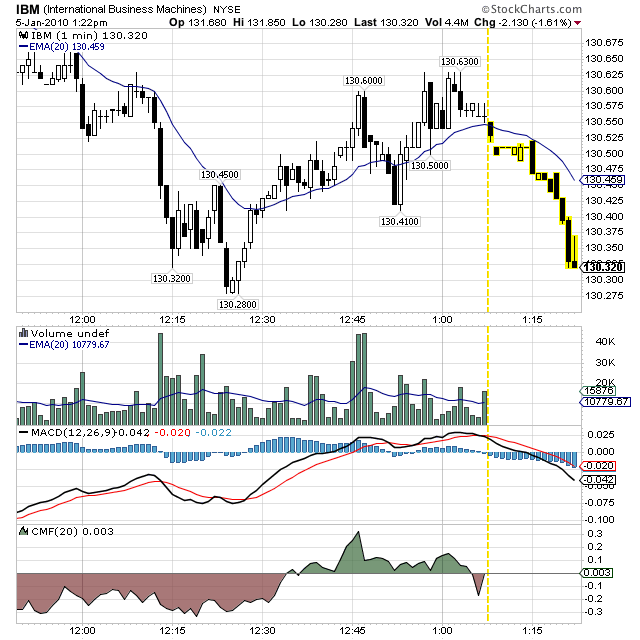
Here is what a 1-minute BATS real-time chart looks like on our website when the market is open:

The dashed yellow line is the dividing line between the BATS data (on the right) and the official NYSE data (on the left). As time goes on, we update this chart in two ways:
- We update the most recent bar (on the far right) with BATS data - adding new bars as necessary.
- We replace the oldest BATS bar (the one next to the dashed yellow line) with official NYSE data as soon as possible; after 15 minutes in this case.
This chart also shows how we do not display volume or volume-based indicators like the CMF for the BATS part of the chart.
5-minute charts work very similar to the chart above. Longer period charts however will not display the dashed yellow line because they only have one BATS-based bar. Those charts - including the daily and weekly charts that free users see - are based on real-time quotes from the BATS exchange and the phrase "+ BATS" appears next to the exchange label in the upper left corner of the chart.
In summary: if you need real-time data for ALL stocks (including Canadian stocks), you'll still need to subscribe to our ExtraRT service. If you need to see real-time volume information, you'll still need to subscribe to our ExtraRT service. But, if those things aren't important, our new BATS-based real-time charts should work well for you and save you some money.
Enjoy! and let us know what you think of the change.
- Chip
(Note: If you currently subscribe to ExtraRT and would like to downgrade to the less expensive Extra + BATS service, please watch the "What's New" area of the homepage next week for an announcement about how to do that.)


