Happy Anniversary! It was one year ago, on March 6, 2009, that the S&P 500 made that unforgettable 666 low, completing an amazing drop from above 1300 in August 2008. That represented nearly a 50% decline in the market capitalization of 500 of the largest U.S. companies in a little more than 6 months. We were already down more than 15% in the year before that remarkable decline. A lot has changed over the past year, specifically the levels at which our major indices are now trading. The old cliche that "time heals all wounds" most definitely can be applied to the stock market. And as a self-proclaimed market historian, 2008-2009 was a period of market turmoil that I'll never forget. There are lessons to be learned from that traumatic period, however. First and foremost, we can never let our guard down, now even for a moment. We shouldn't be swayed by the "experts" paraded on CNBC and other media outlets. Our capital is OUR capital and we must do whatever it takes to preserve and build upon it. The first step that each of us can take is to continually gain a better understanding of how the market works and the warning (technical) signs that suggest that we enter our "defensive" mode.
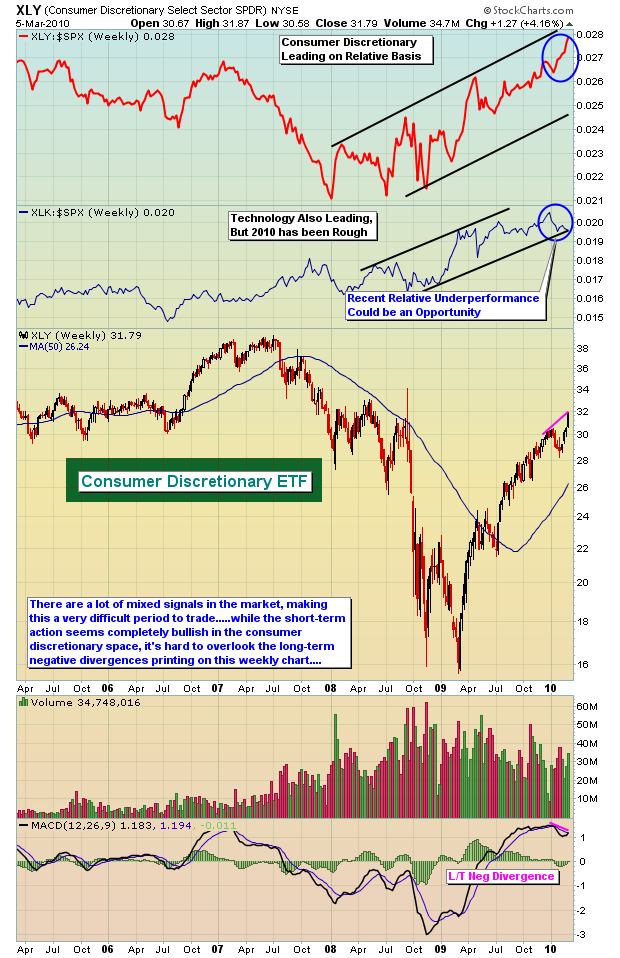
So should we be preserving or building capital right now? Well, that depends on which charts you want to look at. On most of the one year charts, we're overbought but technically very sound. But weekly charts are showing long-term negative divergences, which can translate into weeks of consolidation to downside action. Many of our indices and sectors are at or quickly approaching new 52 week highs. The Russell 2000 finally blasted through 650 with gusto. Consumer discretionary stocks have been on fire. Haven't we been told for many, many months that the U.S. consumer is dead? Tell that to the folks who are pouring billions of dollars into consumer discretionary stocks. If you're looking for leadership, look no further than consumer discretionary. Check out this chart:

The key to trading the stock market right now is understanding the sector rotation that is taking place. I did a brief analysis of two periods. The first period was from the March 6, 2009 low to the May 8, 2009 close. The second period was from the May 8, 2009 close to Friday's close (March 5, 2010). I did this to see how the various sectors performed on a relative basis to one another and to the S&P 500 as a whole during both periods. You can review my analysis by CLICKING HERE. The short answer though is that the initial runup off of the panicked lows were led by all six aggressive sectors while the defensive sectors trailed badly. Since that May 2009 high, however, the defensive groups have performed much better on a relative basis and only the consumer discretionary and technology groups have outperformed considerably since. During 2010 thus far, technology has lagged. If you're bullish, you have to like the prospects of technology on a relative basis here. The aggressive sectors have been taking turns leading the market higher since May 2009. We would expect this to continue until major support levels are lost to the downside. That means attention should be given to technology right now. We ran a scan of technically sound stocks and have provided an interesting one, Ingram Micro (IM) as our Chart of the Day for Monday, March 8th. You can check it out our annotated chart by CLICKING HERE.
Happy trading!


