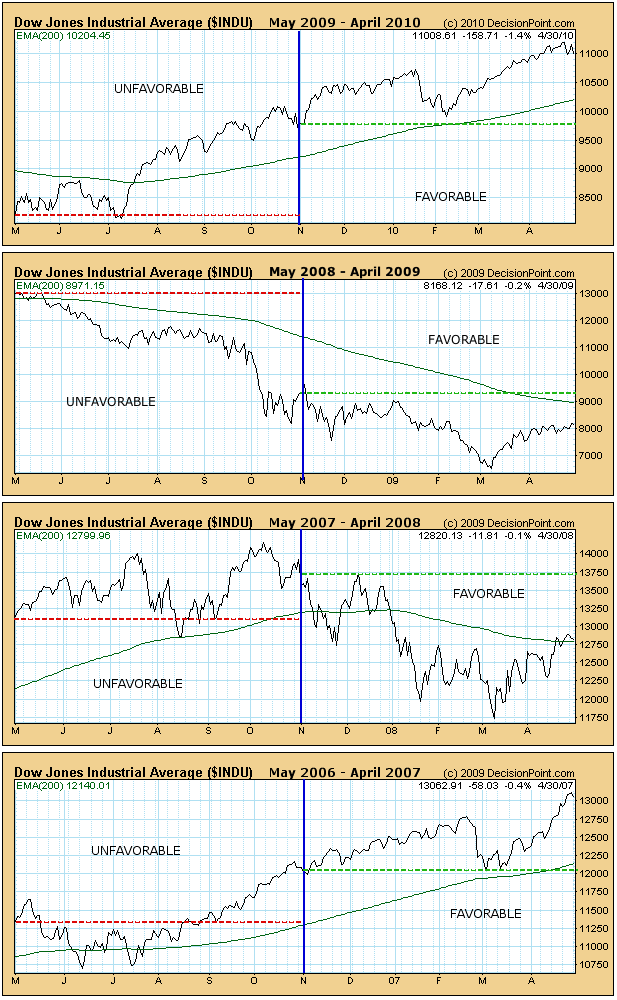
SIX-MONTH SEASONALITY: Research published by Yale Hirsch in the Trader's Almanac shows that the market year is broken into two six-month seasonality periods. From May 1 through October 31 is seasonally unfavorable, and the market most often finishes lower than it was at the beginning of the period. From November 1 through April 30 is seasonally favorable, and the market most often finishes the period higher. (See Sy Harding's book Riding the Bear for extensive details on this subject.)
While the statistical average results for these two periods are quite compelling, trying to ride the market in real-time in hopes of capturing these results is not always as easy as it sounds. Below are one-year charts that begin on May 1, and end on April 30, covering the last four years. The left half of the chart shows the unfavorable May through October period and the right half shows the favorable November through April period. The green line shows the beginning of the favorable period, the red line the beginning of the unfavorable period.

As you can see, regardless of how the market performs on average, every year is different and presents its own challenges, and there is no guarantee that any given period will conform to the average. In fact, it is obvious, at least in the last few years, that bull and bear market pressures will override seasonal tendencies more often than not. Conclusion: Be aware of current seasonal tendencies, but first and foremost follow the primary trend.


