In my last article I suggested the financials were topping and that would make any further advance in the market difficult. Well this past week the action on the NASDAQ and Russell 2000, home of the high beta stocks, confirmed the bearish action. We've seen several warning signs develop over the last several weeks. These include extremely overbought conditions on both daily and weekly timeframes, negative divergences on the MACD on daily and weekly timeframes, outrageous relative complacency unlike anything we've seen since the CBOE began providing us equity only option data in 2003, and significant price resistance levels.
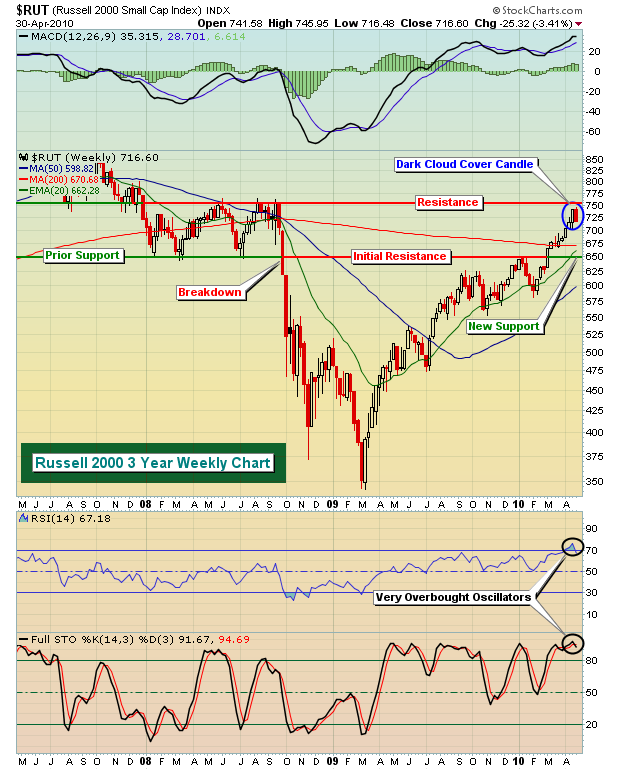
First, let's take a glance at the Russell 2000:

The 650-750 area appears to be the trading range for the Russell 2000 now. After weeks of steady movement higher, the bearish dark cloud cover candle from last week suggests the near-term is likely to be a bit more dicey. The 20 week EMA is at 662 and rising and that too has proven to be a solid support level over the past year. The Russell 2000 is being featured as our Chart of the Day for Monday, May 3, 2010 and can be viewed by CLICKING HERE.
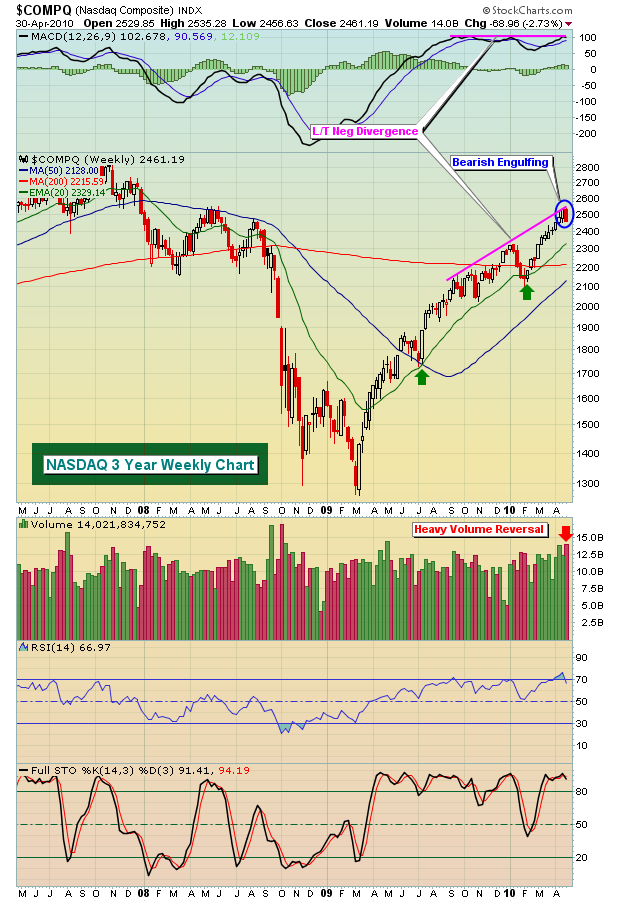
The NASDAQ is a bit more bearish considering that it still has a long-term negative divergence present on its weekly chart. That has the potential of leading to a 50 week SMA test to "reset" this oscillator. Take a look:

I discussed in my last article the tendency for the S&P 500 to follow the lead of financials. Given the relative weakness in that group, we must respect the likelihood that another consolidation period began this week. Having the NASDAQ, a leader during the advance off the February lows, confirm our many bearish indicators with a DAILY close beneath its 20 day EMA for the first time since February is simply more evidence that the market is likely to take the breather it very much needs and deserves. The Russell 2000, another relative leader since February, closed a fraction above its 20 day EMA on Friday and should be watched closely as a new trading week unfolds.
Until new highs emerge on our major indices, I'd view any short-term strength as an opportunity to lighten up on longs and/or hedge against further near-term weakness. I'm not bearish equities at this point as a major uptrend is still intact, just cautious given the warning signs, elevated risks and an underperforming financial group.
Happy trading!


