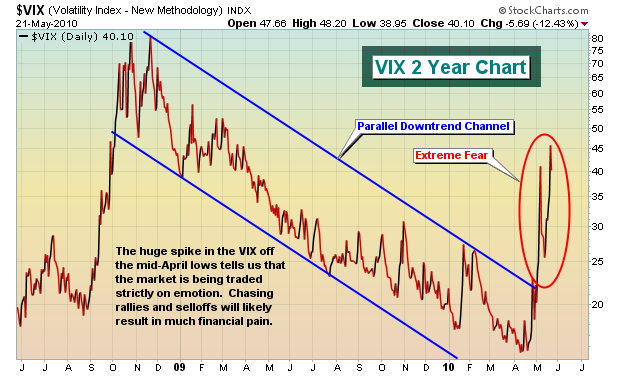
Many traders look at volatility and think huge potential rewards. I look at it and think huge potential risks. I know I'm conservative, but it's two different ways of viewing the same market. I concede that if you're on the right side of each extreme move, potential profits await - and big ones. But good luck being on the right side each time it moves. When the VIX rises as it's done the past two weeks, emotions rule the market. Fundamentals? Puh-lease! Hewlett Packard (HPQ) beat its quarterly EPS estimates, then raised guidance. It's reward? At the low on Friday, it was down 5% from its stellar earnings report, and that was on top of the 10% it was already down in May prior to that report. Congratulations HPQ, welcome to a fear-driven market. Volatility is routinely measured by the Volatility Index, or VIX. Check out the chart on the VIX and how it's risen dramatically off the mid-April lows:

Many who love the volatility and the possibility of big gains may also like trading the juiced ETFs. Let me just say be careful. I've done much research on these trading vehicles and produced educational videos on this subject. They are not long-term trades and holding on during extended periods in an extremely volatile period can be absolutely lethal. Let me give you a recent example. On April 27th, the Dow Jones US Financial Index (DJUSFN) closed at 288.21. On May 12th, the DJUSFN closed at 288.18. So 15 days later and nearly an identical close. The UYG (ultralong ETF that tracks the DJUSFN at a 200% clip) fell by nearly 1%. The SKF (ultrashort ETF that tracks the DJUSFN inversely at a 200% clip) fell nearly 2.5%. Losers were on both sides of this trade. This "slippage" occurred in just two weeks! Imagine holding these juiced ETFs for months, or even years! These are VERY short-term trading vehicles only. They are not designed to be held for longer than one day. The only time it will benefit you to hold for longer than one day is if you're on the right side of the trend and the trend continues without whipsaw volatility. In that case, the compounding nature of juiced ETFs actually increases your returns GREATER than the desired 200%.
Here's an example of what I'm talking about:
After that May 12th close on the DJUSFN of 288.18, financials tumbled for six straight days. The DJUSFN fell 11.20% during that period. If you were fortunate enough to be riding the SKF during those six days, you'd have made 25.14%. Given the 200% "expectation", the SKF should have gained 22.40% during that period. But it was the compounding of gains with juiced ETFs that actually exceeded the expectations of a doubling. That's why I always discuss trading these juiced ETFs only when the underlying index is at a key support or resistance level on the chart. If you catch a reversal, you can hold as long as the trend moves in your favor. But always remember that back-and-forth, volatile action cripples your performance. Thus, juiced ETFs should NEVER be considered a long-term holding. It's one of the few times I can say with certainty that you WILL lose your money if you hold long enough.
The extreme volatility is also creating problems for traders because of huge gaps in both directions at the opening bell. Knowledge of gap trading is very important. Most gaps are of the common gap variety, meaning they'll usually revert back to the prior close, "filling" the gap. But there are other types of gaps that must be recognized at the time of, or just after, the gap in orderly to appropriately trade and minimize risk. Last week, I held the second in our monthly Online Trader Series, "Learning to Trade Gaps with Precision". You can still access this video. Also, check out the exhaustion gap that we identified on Chipotle Mexican Grill (CMG) on our Chart of the Day from a week ago. CMG fell 13 dollars after we featured it. For more details on the CMG chart and on gap trading strategies, CLICK HERE.
Happy trading!


