Hello Fellow ChartWatchers!
With the market posting four solid up days over the past week, is now the time to get back in to the market? That's the main topic of this week's newsletter and there are lots of opinions going around right now.
One of the key things to watch for after a prolonged market decline are the major market breadth indicators like the NYSE Bullish Percent ($BPBYA) and the NYSE Summation Index ($NYSI). Like all market indicators, these lines condense the movement of hundreds of stocks down into a single line that can be used as a proxy for the overall health of the market.
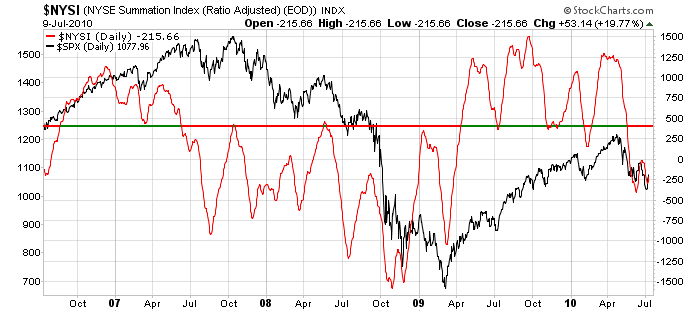
Here's a chart of the NYSE Summation Index (red) overlaid on top of the S&P 500 (black):

(Click here for a live version of this chart.)
The horizontal line on that chart illustrates that, for the past couple of years at least, things always get "interesting" when $NYSI approaches the 400 level. (The vertical scale for $NYSI is on the right, the scale for $SPX is on the left.) Notice the behavior of $SPX whenever $NYSI moves above or below the 400 line - strong, long-term trends usually occur. Granted, the signal usually happens well after the start of the trend, but that's always the tradeoff - early entry versus whipsaws. If whipsaws aren't your cup of tea, the $NYSI at 400 signal should do well for you.
It also lends perspective to the current market rise. With $NYSI currently at -215, it is too early to declare the return of a bull market. That said, if the Summation Index continues to rise and breaks through 400 then greater optimism is definitely warranted.
- Chip


