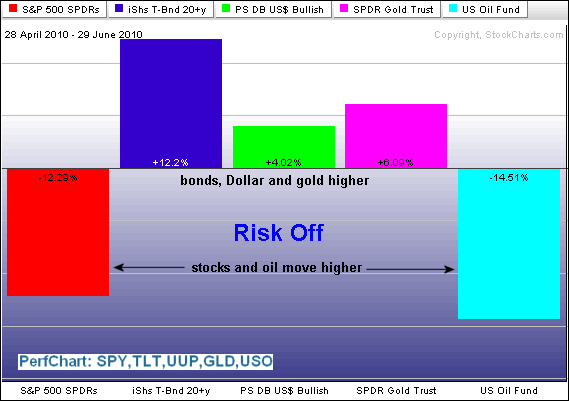
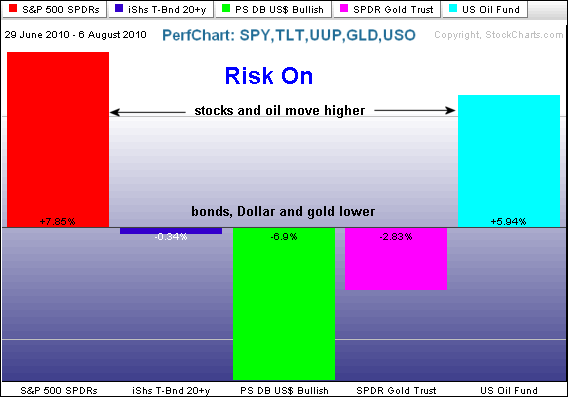
The intermarket picture shows a preference for the risk-on trade over the last five weeks. The next two PerfCharts show five intermarket ETFs over two distinct timeframes. The first extends from late April until late June, which is when stocks declined sharply. The second extends from early July to early August, which is when stocks advanced sharply. A sharp decline in stocks reflects risk aversion or the risk-off trade. Weakness in stocks extended to oil, which has been positively correlated to the stock market all year. The risk-off trade also involves a flight to safety. Notice that bonds, the Dollar and gold advanced when stocks were weak. The second PerfChart, which extends from early July to early August, is pretty much the inverse of the first. Stocks advanced sharply and this coincided with an advance in oil. Strength in stocks means investors are embracing risk. Unsurprisingly, the flight-to-safety securities suffered over the last five weeks as bonds, the Dollar and gold moved lower.


Click these images to see a live PerfChart


Click these images to see a live PerfChart

About the author:
Arthur Hill, CMT, is the Chief Technical Strategist at TrendInvestorPro.com. Focusing predominantly on US equities and ETFs, his systematic approach of identifying trend, finding signals within the trend, and setting key price levels has made him an esteemed market technician. Arthur has written articles for numerous financial publications including Barrons and Stocks & Commodities Magazine. In addition to his Chartered Market Technician (CMT) designation, he holds an MBA from the Cass Business School at City University in London.
Learn More


