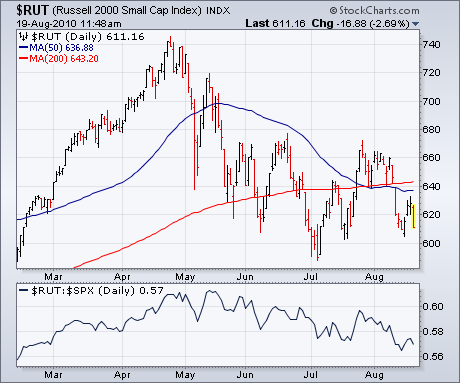
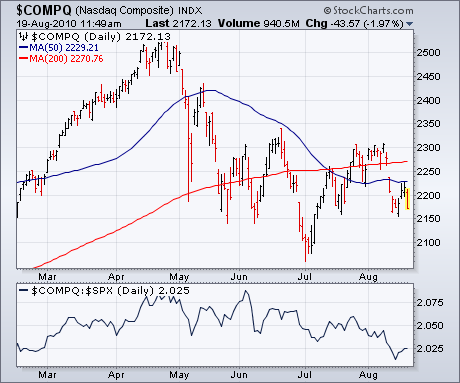
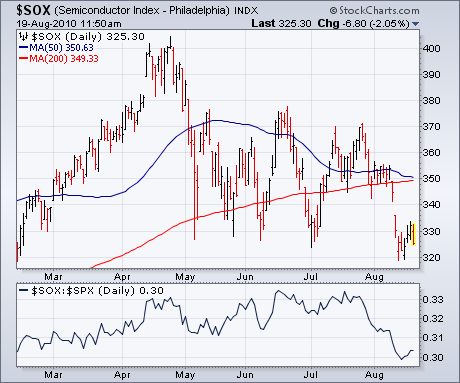
It's usually a bad omen for the market when small caps and technology stocks are underperforming -- as they're doing at present. Chart 1 shows the Russell 2000 Small Cap Index trading closer to its July low than its July high. Its falling relative strength line also shows small-cap weakness. The same is true for the technology-dominated Nasdaq market. Chart 2 shows the Nasdaq Composite meeting resistance at its (blue) 50-day average (having never closed the overhead resistance gap formed last week). It's also dangerously close to breaking support near 2150. Its falling relative strength shows it leading the S&P 500 lower. A big reason for the Nasdaq underperformance can be seen in Chart 3 which shows the Semiconductor (SOX) Index having already broken its summer low. Notice the steep drop in its RS line since mid-August. Semiconductor weakness is usually bad for the Nasdaq which is bad for the rest of the market. That increases the odds for more stock selling.


