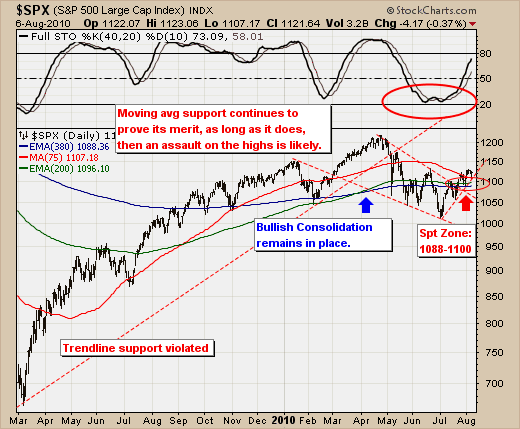
To review, the S&P 500 bottomed in July with perhaps the best internal breadth figures we've seen in quite sometime. And, no one can refute that the S&P has broken out of a bullish consolidation and above major moving average resistance levels at 1008 and 1096, and remains above the 75-day trading moving average at 1107. Moreover, the 40-day stochastic remains in a clear uptrend. Hence, the path of least resistance is technically higher...regardless of the bearish fundamentals.
Therefore, one should consider long positions on corrections back into support at 1107 such as Friday's late day rally surge in lieu of a move to new highs above 1230. This is a diffucult trade to get one's hands around given the negative sentiment, but if we can compare this period to any other in recent memory - then it would be the rally after the initial "financial earthquake" in the Summer of 2007. Shortly thereafter, the S&P rallied to a new all-time high with talks of a "pause that refreshes", but in reality it was something far worse. Thus, we wouldn't be surprised to see the S&P climb towards the 1250 level by sometime in late August or early September before giving way to sharply lower prices.


