Great question. There are as many arguments saying "no" as there are those saying "yes". Who do you believe? In August, our major indices were tumbling and it seemed like every media outlet was touting our doom and gloom. By the end of September, psychologically it seemed like a completely different market. There are a ton of reasons to like the market to keep doing what it's been doing. Price action has been superb. The Moving Average Convergence Divergence (MACD) is based on price and the divergences are solid across all timeframes. Those weekly MACDs, which looked so ugly back on those April highs, suggested a rough summer ahead and that's what we saw. Currently, however, the MACDs on the weekly timeframes look super. They've all crossed back above the centerline and are pointing straight up. This tells us that bullish momentum will support higher prices.
But price action is only half the story. The other half is big too, and that's the side that deals with volume. I love the analysts who try to make excuses for the market and tell us that this time it doesn't matter and then proceed to lay out all the reasons why. VOLUME ALWAYS MATTERS. Don't let anyone tell you otherwise. It's the combination of price and volume that matters. Neither one without the other can be relied upon - in any market. So exactly what kind of what volume matters? Well, this is where judgment is involved. I'll be the first to say that you won't see the same type of volume during periods of market strength that you'll see during market selloffs. Fear is a very powerful emotion, one that makes most of us do things we wouldn't ordinarily do. And when fear involves the loss of money, really strange behavior takes over. The acceleration of volume during periods of panic will never be matched by the acceleration of volume during periods of market ascent. In other words, we shouldn't be looking for the type of volume we saw in May (during the flash crash) to confirm the recent market strength. It's very, very unlikely to happen. We should see above average volume though.
I spoke for weeks about the importance of 1131 resistance on the S&P 500. That was the June reaction high. In August, the S&P 500 rose to intraday highs between 1120 and 1130 on 7 consecutive days without once trading above 1131. In September, we saw five more consecutive sessions approach 1131 without a breakthrough. On September 20th, the sixth consecutive intraday attempt at 1131 finally worked. 13 times we tried to penetrate 1131 and we failed. The bulls tore down what appeared to be an impenetrable wall of resistance. Every technical analyst I follow talked about the importance of 1131 resistance. Given that this major level of resistance was lifted, the short covering would begin in earnest, right? Cash on the sidelines would finally pour in, right? Hardly. A summer's worth of resistance was taken out on......3.4 billion shares on the S&P 500. Let's put this in perspective. The average daily volume on the S&P 500 during September prior to the 20th was 3.7 billion shares. The average daily volume on the S&P 500 during August (a very slow month for equities historically) was 3.9 billion shares. The "long-awaited" breakout after 13 failed attempts occurs on 3.4 billion shares and we're supposed to be ok with it? Pardon me, but I can't get excited by the action.
I view the lack of volume as a negative and a signficant red flag. It doesn't mean I'd be shorting. We do have to respect the price action. The market is sending me loads of mixed signals and they're not all related to price/volume. Consider sentiment for a moment. I like to follow the VIX and the equity only put call ratio. The latter rose to extreme levels back in April and that made it easier to call a top. Currently, the action in options is quite boring, if I'm being honest. There are no impending signs of a market top and that may be one of the reasons September was such a strong month. It's hard to imagine that few would trade equity calls given the straight up move in September, but the facts speak for themselves. Leading up to the April 26th top, the equity only put call ratio averaged .47 month-to-date in April. During that same period, an average of 1.95 million equity call contracts were traded each day. Now let's fast forward to today. During September, the equity only put call ratio averaged .58 and an average of 1.13 million equity call contracts were traded each day. Does that sound like a complacent market that's ready to reverse big time to the downside? Nope, not to me either. The VIX, on the other hand, is more bearish. Despite a significant rally in equities during September, the VIX finished the month slightly below where it was on September 2nd. Ordinarily, the VIX moves inversely to equities. While equity prices were rallying strongly throughout the month, it seemed as though VIX traders weren't buying into it. The VIX has stubbornly remained in the 21-24 range. The message that sends to me is traders are looking for increasing volatility down the road. Increasing volatility is associated with weakening equity prices. So should we follow the equity only put call ratio and its flippant attitude or the lack of bullish behavior in the VIX? The VIX is included as our Chart of the Day for Monday, October 4th. CLICK HERE to see how the VIX is failing to confirm the bullish market action of late.
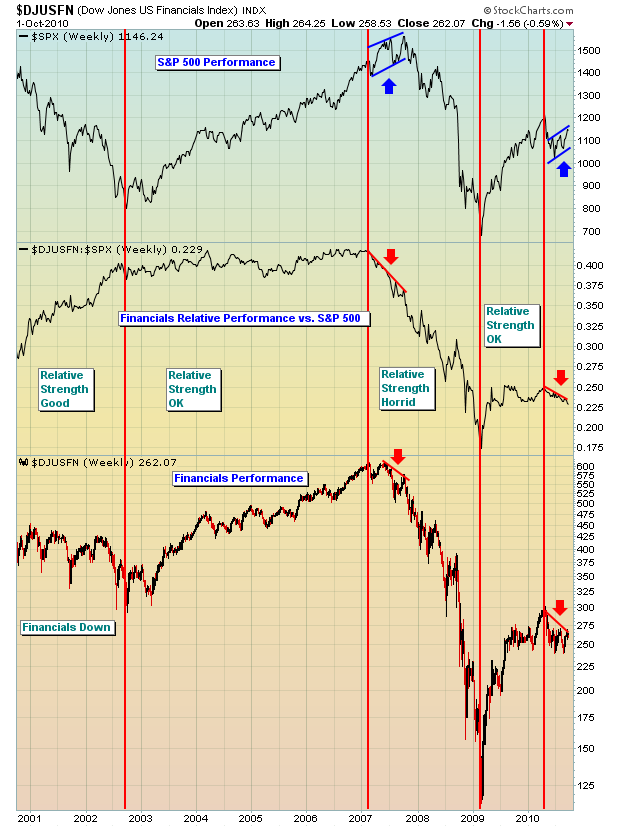
There's one really big problem this rally faces in my opinion, and it's the poor relative performance of financials. The financial group should act much healthier in an improving economic environment. Money should be flowing TO the group, not AWAY from it. While the media outlets would have you believe our economy is on the improve, and many economic reports would confirm this belief, the lack of money flowing to financials while an exorbitant amount flows to bonds simply doesn't support this argument. It's as if Wall Street is telling us one thing and doing the opposite. They wouldn't do that, right? If banks and other financials aren't technically as strong as the remainder of the market, I have problems buying into the improving economy theory. Sorry. Look at this chart:

In my view, when the financial sector is falling and its relative strength is also falling at the same time the overall market is rising, it's a MAJOR warning sign. We saw it in 2007 just before the market began its most recent bear market. We also saw the relative strength of financials weaken in April as the market neared a significant intermediate-term top. Currently, we have the market rising while BOTH financials AND their relative strength are dropping. I can't help but be cautious is this type of environment. If I leave some money on the table, then so be it. When it comes to preservation of capital, cautiousness always prevails over greed.
The price action remains bullish and we'll continue to do what we've been doing at Invested Central. That's trading fewer shares, mostly on the long side for now, but with both eyes fixated on the exit sign. If you adamantly wish to remain on the long side, consider hedging strategies to minimize risk. It wouldn't be prudent to trade this market without insurance.
Happy trading!


