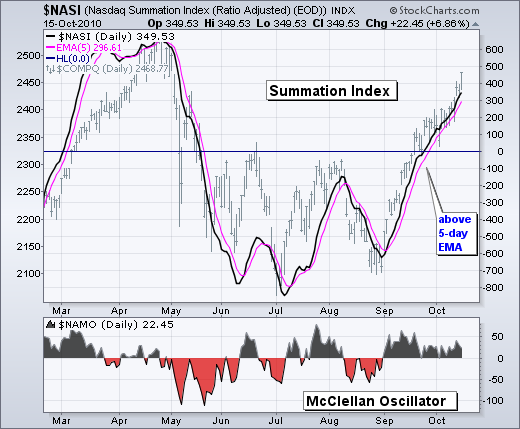
Even though stocks are overextended after a massive seven week run, we have yet to seen any evidence of weakness that would signal the start of a correction or pullback. Many momentum oscillators are also at or near overbought levels, but cumulative indicators, such as the McClellan Summation Index, continue moving higher to capture the current uptrend.
Think of the Summation Index as the smoother cousin of the McClellan Oscillator. Basically, the McClellan Oscillator equals the 19-day EMA of Net Advances less the 39-day EMA of Net Advances. Like MACD, it captures momentum by taking the difference of two moving averages. This indicator oscillates around the zero line as momentum shifts for Net Advances. The Summation Index is a cumulative McClellan Oscillator. As a cumulative indicator, it is smoother than the McClellan Oscillator and has fewer crosses above/below the zero line. It also trends.

Click this image for a live chart.
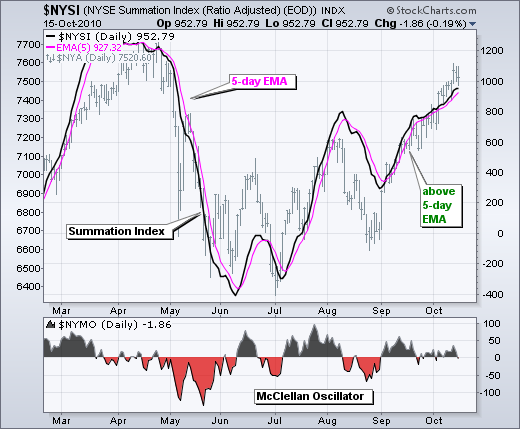
The charts below show the Summation Index with a 5-day EMA to identify upturns and downturns. This may seem like a tight moving average, but the Summation Index is already smooth and this short moving average identifies the turns pretty well. Notice that the Summation Index moved above its 5-day EMA in early September and remains above this moving average. There is no questioning the uptrend in the Summation Index. As long as this breadth indicator remains above the 5-day EMA, I would expect the current rally to continue, even if conditions are overbought. A break below this moving average would signal weakness in breadth that could give way to a correction or pullback in the market. The second chart shows the NYSE Summation Index ($NYSI) with similar characteristics.

Click this image for a live chart.


