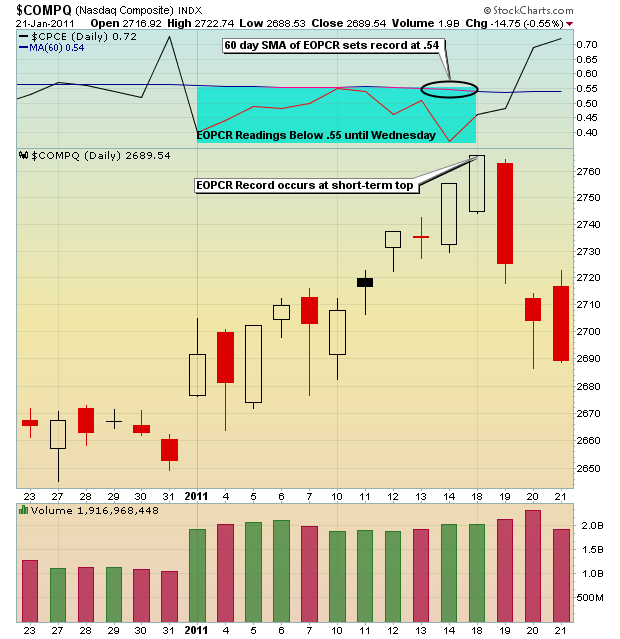
Complacency in the market was setting records this past week. The technicals? They look great. But can the market keep moving higher short -term when options traders are betting on it en masse? Well, maybe, but if you enter stocks on the long side at this level, please understand the risk bar has been raised significantly. Don't misunderstand my message. I'm intermediate-term to long-term bullish and have been that way since shortly after the bottom formed in March 2009. There have been short-term periods, however, when it's made sense to take a more conservative approach to trading. ANY time complacency grows, I get nervous. Why? Because market makers are VERY good about making money and they do it at the expense of you and me. As more and more folks trade call options on a relative basis, the odds grow that a near-term top is fast approaching.
Tons of net call option premium evaporated the last three trading days. The NASDAQ lost 3% of its value from Wednesday's open to Friday's close and that shouldn't surprise anyone who follows max pain, which I define as the point at which in-the-money call premium equals, or offsets, in-the-money put premium. It's generally in the market makers' best interests for prices to gravitate towards max pain into option expiration Friday. So between the complacency and max pain, the bulls faced a huge short-term hurdle as January options expired Friday. Unfortunately for the bulls, the market makers won again. In my view, it's another form of TARP for the financials. The good news for the Goldman Sachs of the world is that this TARP money doesn't have to be repaid. Wonderful! (sarcasm intended)
Since 2003, the CBOE has been providing information relating to the equity only put call ratio (the "EOPCR"). The average daily EOPCR since 2003 is .65. The 60 day SMA of the EOPCR is at .54. This is the lowest reading for this 60 day SMA on record. The first such reading occurred on Tuesday. Take a look at a one month chart on the NASDAQ:
Our trading strategy is to build cash during market advances where complacency reaches record or extreme territory. Attempting to short the market can result in pain as overbought conditions can typically remain overbought for a period of time. So as risks increase on the long side, we simply choose to take profits and use any weakness to re-establish positions. My latest educational feature at Invested Central is the Anatomy of a Trade where I detail recent trades issued to our members to provide insight into our risk management style and strategy. A well thought out plan of entry and exit points BEFORE the actual purchase is critical to trading success in my view. To view my latest Anatomy of a Trade, CLICK HERE.
Happy trading!


