ChartWatchers

VIX STARTS TO BOUNCE

John Murphy

John Murphy

Chief Technical Analyst, StockCharts.com

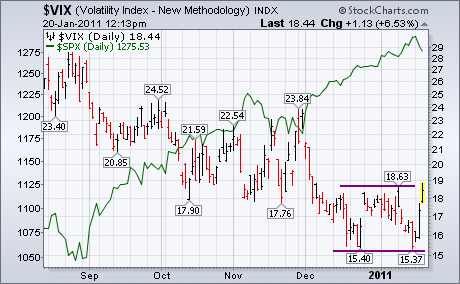
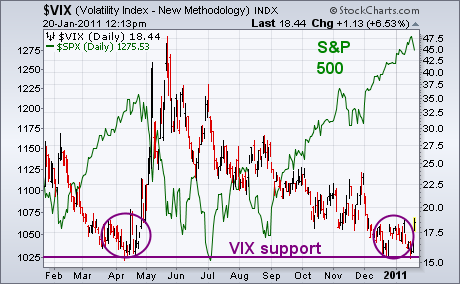
Two Thursday's ago (January 6), I showed the CBOE Volatility (VIX) Index having reached a potential support level at last spring's low near 15, and warned that a bounce off that level could cause a stock market pullback. That's because the VIX and stocks usually trend in opposite directions as shown in Chart 1. The reason I'm coming back to the VIX today is because it's climbing 8% and beginning to look like it's short-term trend is turning up. Chart 2 shows the VIX action more closely. After bouncing twice off support near 15 since mid-December, the VIX is challenging its early January intra-day high at 18.63. A close over that initial resistance barrier would turn its short-term trend higher and could signal an overdue pullback in the stock market.

20110120001-sc

20110120002-sc

John Murphy
About the author: is the Chief Technical Analyst at StockCharts.com, a renowned author in the investment field and a former technical analyst for CNBC, and is considered the father of inter-market technical analysis. With over 40 years of market experience, he is the author of numerous popular works including “Technical Analysis of the Financial Markets” and “Trading with Intermarket Analysis”. Before joining StockCharts, John was the technical analyst for CNBC-TV for seven years on the popular show Tech Talk, and has authored three best-selling books on the subject: Technical Analysis of the Financial Markets, Trading with Intermarket Analysis and The Visual Investor. Learn More