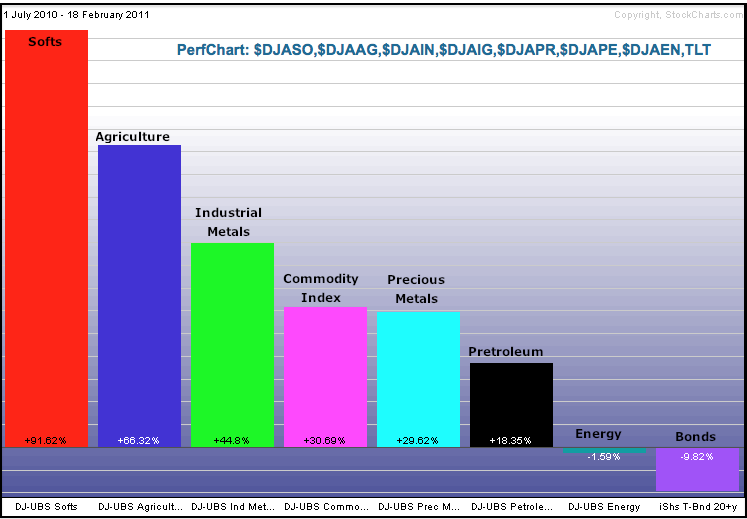
Except for natural gas, most major commodities and commodity groups are up sharply over the last 6-8 months. Stockcharts.com provides a broad range of Dow Jones-UBS commodity related indices. The PerfChart below shows seven commodity related indices and the 20+ year Bond ETF (TLT). Five represent major commodity groups. The DJ-UBS Commodity Index ($DJAIGT) represents commodities as a whole and the DJ-UBS Petroleum Index represents the oil complex (crude, gasoline, heating oil).

Click this image for a live chart.
So-called "softs" and agriculture are leading the way higher. Softs consist of sugar, coffee and cotton. Agriculture represents corn, soybeans, wheat, sugar, soybean oil, coffee and cotton. The message here is clear. Prices for agricultural related commodities are rising, and rising fast. The DJ-UBS Softs Index ($DJASO) has almost doubled, while the DJ-UBS Agriculture Index ($DJUSAAG) is up over 65%. These big gains will almost certainly filter down into the prices at the retail level, which would be inflationary. Perhaps that is why bonds are down sharply over this same timeframe.


