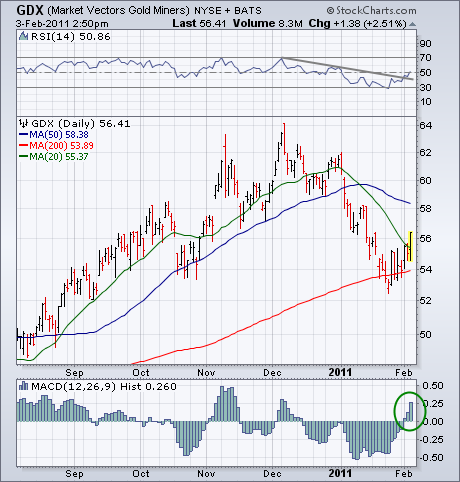
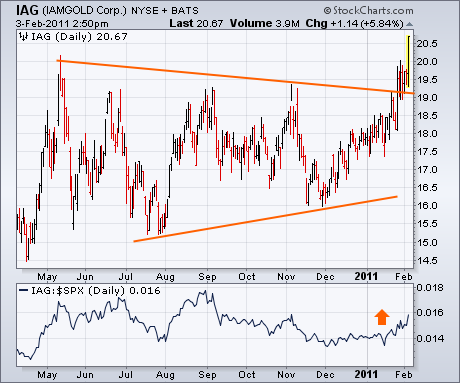
My Tuesday message showed the Market Vectors Gold Miners ETF (GDX) testing long-term support at its 200-day moving average, and suggested watching it closely for signs of an upturn. Today's strong rally in precious metals assets may be the start of that upturn. Chart 1 shows the GDX surging more than 2% today and clearing its 20-day moving average (green line) for the first time this year. In addition, its 14-day RSI line (top of chart) has turned back up. The daily MACD histogram (below chart) has also turned positive (see circle) for the first time in two months. In my view, those signs of improvement increase the odds that the pullback in precious metal stocks is over. The Tuesday message identified IAMGOLD as the strongest gold stock and showed it having broken through the upper line in a bullish "symmetrical triangle". Chart 2 shows IAG exceeding its spring 2010 high to reach a new record. Its relative strength ratio (bottom of Chart 2) has turned up as well. Gold and silver stocks are rallying on the backs of their respective commodities.


