ChartWatchers

DOLLAR INDEX DROPS TO THREE-YEAR LOW

John Murphy

John Murphy

Chief Technical Analyst, StockCharts.com

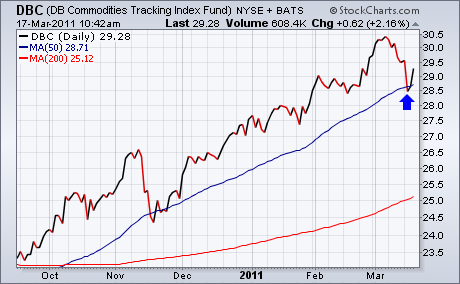
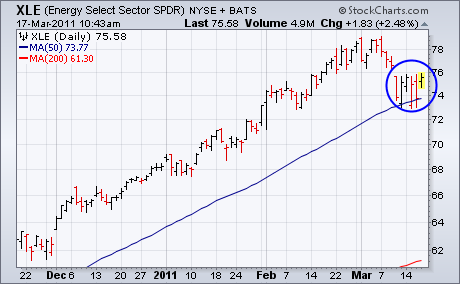
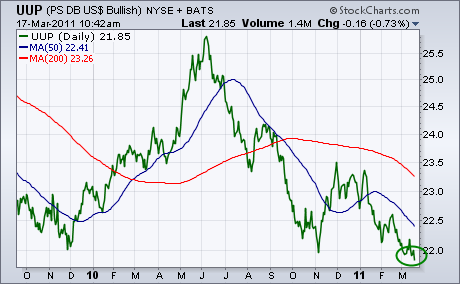
Traders continue to sell the U.S. Dollar. In yesterday's trading, the dollar fell to a 20-year low against the Japanese yen. Today, it's falling against everything else. More importantly, the greenback is breaking important support levels. Chart 1 shows the PS Bullish Dollar Index (UUP) falling to the lowest level in three years. One of the side-effects of a falling dollar is stronger commodities and shares tied to them. Right on cue, both are bouncing. Chart 2 shows the DB Commodities Tracking Index Fund (DBC) bouncing off its 50-day moving average (blue line) and gaining 2%. Virtually all individual commodities are bouncing today. As are shares related to them. Chart 3 shows the Energy Sector SPDR (XLE) bouncing off its 50-day line. Precious metal shares are also rebounding.

20110317001-sc

20110317002-sc

20110317003-sc

John Murphy
About the author: is the Chief Technical Analyst at StockCharts.com, a renowned author in the investment field and a former technical analyst for CNBC, and is considered the father of inter-market technical analysis. With over 40 years of market experience, he is the author of numerous popular works including “Technical Analysis of the Financial Markets” and “Trading with Intermarket Analysis”. Before joining StockCharts, John was the technical analyst for CNBC-TV for seven years on the popular show Tech Talk, and has authored three best-selling books on the subject: Technical Analysis of the Financial Markets, Trading with Intermarket Analysis and The Visual Investor. Learn More