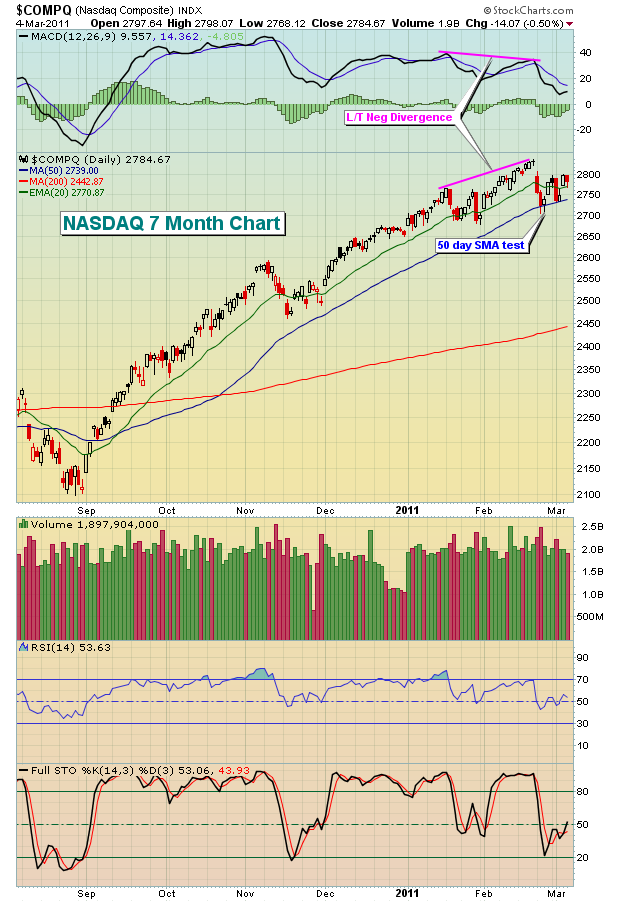
It's hard to believe it's been two years since that infamous 2009 March bottom. I'm going to focus on the NASDAQ for purposes of today's article. Let's take a quick look at the advance since late August 2010 to gain a real appreciation for how far the NASDAQ has come in such a short period of time:

The NASDAQ rose nearly 35% in less than 6 months. That came AFTER the NASDAQ had already bounced 75% from the March 2009 low to the August 2010 low shown above. It's truly been a remarkable recovery as the NASDAQ recently approached its 2007 highs at 2859. The obvious question is, "Where do we go from here?" Is there any gas left in the tank? I believe there is. Take a look at that 7 month chart above again. Notice the slowing momentum in February, evidenced by the lower MACD with rising prices? That's a sign to be very careful in the near-term. From an educational perspective, that development is important because it tells us that the shorter 12 day EMA is beginning to converge with the 26 day EMA despite rising prices. That's unusual because as prices rise, I expect the short-term moving average to move up more rapidly and diverge from the 26 day EMA. This, along with declining volume, are two signs that suggest momentum is slowing. Positive and negative divergences are a trader's best friend as it's a clear signal that risks are rising. If your trading strategy involves risk management, you cannot afford to ignore MACD signals.
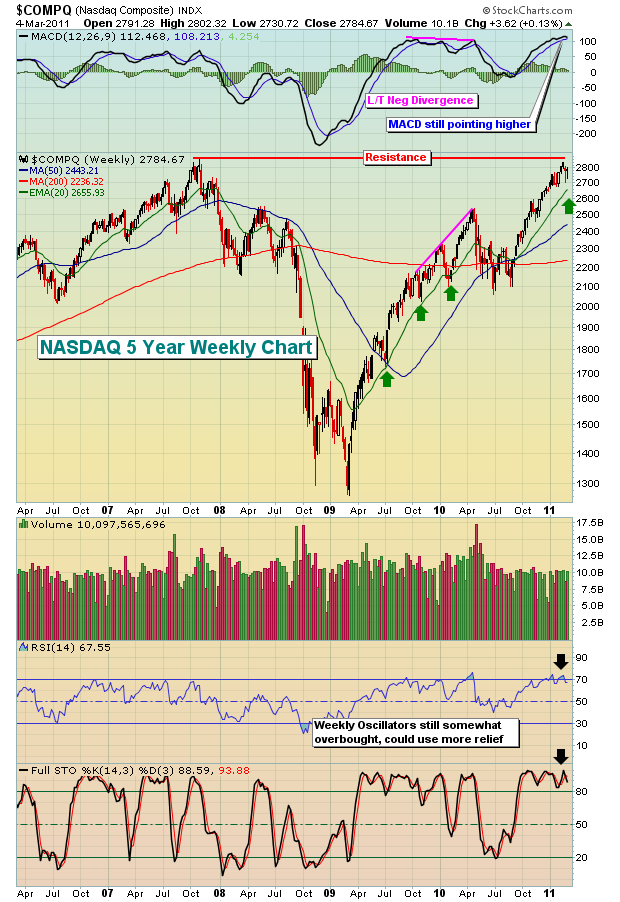
Now let's look at the longer-term view of the NASDAQ, which I find to be very bullish:

Back in April 2010, prices were moving higher with a lower MACD and that led to well-documented issues over the summer. I had previously discussed warning signs back in April prior to the selling, but those same warning signs are not present right now. We're overbought and could use some selling to consolidate the significant gains, but the MACD is not suggesting the bullish momentum is about to end. After the long-term negative divergence on the MACD in April, notice that weekly prices fell until the NASDAQ tested its 50 week SMA. Also, note the MACD centerline test over the summer. That's the type of selling necessary to "reset" the MACD back to the centerline, which is the technical point where the 12 period and 26 period EMAs are exactly equal. From there, in my opinion, the market was once again left to do its own thing, which in this case turned out to be another bullish move. Note the green arrows above on the chart. During periods when the MACD has been strong, pullbacks are generally contained by the 20 week EMA. Currently, that 20 week EMA resides at 2656. If selling resumes in the days and weeks ahead, you'll want to keep a close eye on this level.
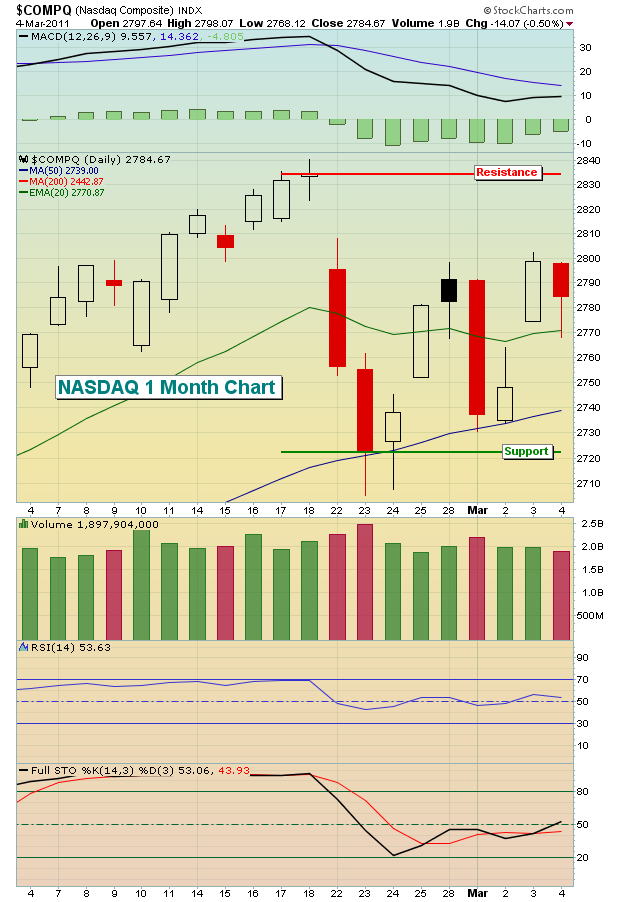
In the very near-term, the trading range on the NASDAQ is 2723-2835 as reflected on the very near-term one month chart shown below:

The consolidation is welcome relief and we hope it continues a bit longer to form a nice base. Should the price support be violated near 2723 on a closing basis, the NASDAQ will likely head back to test that 20 week EMA where a much more significant intermediate-term battle will take place.
Given the market turmoil the last few years, Invested Central conducted a member-only survey to find out more about what traders are looking for and how well we've met those needs. You might find the highlights interesting and are welcome to CLICK HERE to learn more. As always, feel free to join me as I break down a recent trade candidate with our featured Anatomy of a Trade. CLICK HERE for the latest candidate.
Happy trading!


