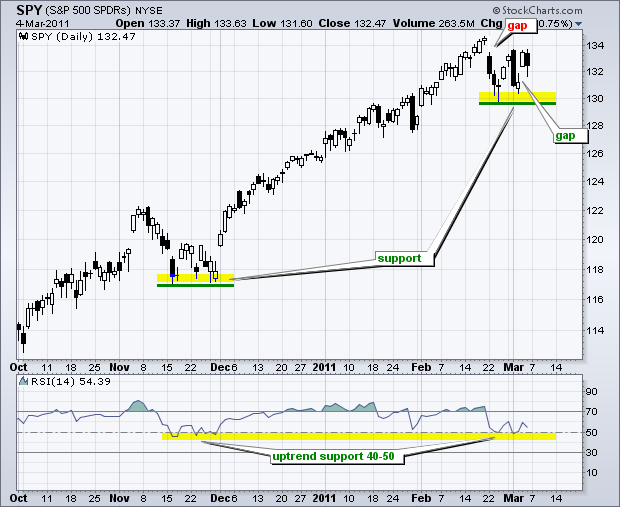
The S&P 500 ETF (SPY) is hitting resistance from last week's gap down, but may just find support from this week's gap up. The latest round of gaps started with a gap down from a new high on 22-February. The ETF rebounded later that week, but fell sharply on Monday with a long black candlestick. This candlestick met resistance from the 22-February gap. SPY firmed above its late February low and gapped up on Thursday. However, once again, the ETF met resistance from the 22-Febuary gap with a decline on Friday. This puts the ETF between a rock (gap down) and a hard place (gap up). The first one to be filled will offer a good clue on the next directional move.

Click this image for a live chart
Overall, the trend on the daily chart remains up. SPY is holding the support zone around 130 and RSI is holding support in the 40-50 zone. This zone held in November and late January. A move below 40 in RSI and 129.5 in SPY could signal the start of a correction that retraces a portion of the September-February advance.


