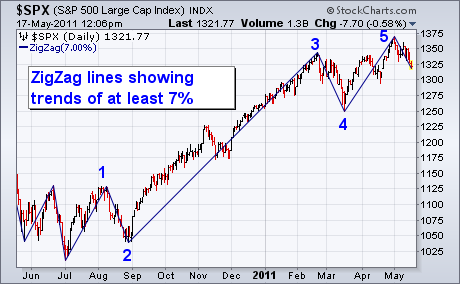
Determining Elliott Wave counts can be very subjective. One way to make it little easier is to employ a "ZigZag"overlay on the price chart. [The ZigZag is located in the same Overlays menu that includes moving averages]. The idea of the ZigZag overlay is to apply a percentage filter on market trends. The default setting is 5% which means that only price moves of at least 5% are shown. Anything smaller than 5% is ignored. You can change the percentage filter to make the lines more or less sensitive. I increased the ZigZag filter to 7% in Chart 1 to show the two 7% corrections from last August and this March without upsetting the 5% line count. The lines help eliminate some of the subjectivity when counting market waves. Chart 1 shows five clear lines since last summer's bottom. Three up lines and two down lines. [The numbers were added by me]. Elliott Wavers know that five-wave advance is usually a signal that an upmove has been completed and that correction within the uptrend is likely. I've also recently shown a number of negative divergences on daily and weekly indicators like RSI. Why that's important is that fifth wave negative divergences are usually more serious warnings of a market correction.

