It was a little more than one year ago - in April 2010 - that I began warning about a potential top approaching. We now know what happened in May and June of that year. Well, the warning signs are mounting again and, barring technical changes, we could be in for a very rough summer.
Where does the market stand? Well, tell me if you're looking short-term or longer-term and I'll give you two different answers.
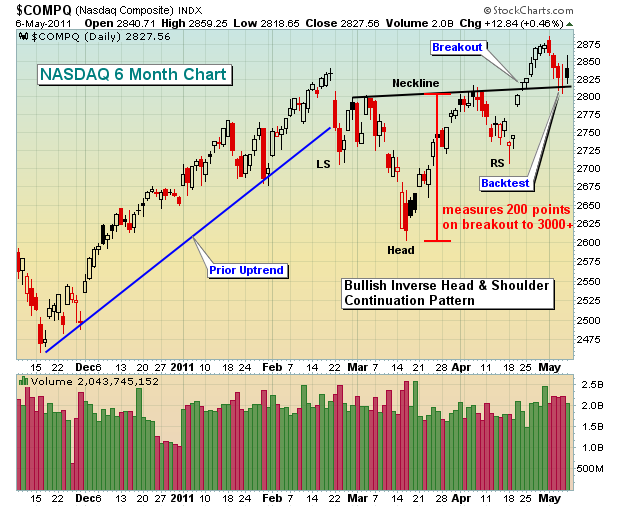
Let's start short-term. When I look at a six month chart of the NASDAQ, I see nothing but bullish signs. There was a very bullish continuation pattern in play - an inverse head & shoulders. While a head & shoulders pattern after an uptrend is a potential topping pattern, the "inverse" head & shoulders carries very bullish implications upon breakout. Check out the chart on the NASDAQ below:
After the breakout, last week's pullback should not be viewed bearishly as these types of patterns often show backtests of the breakout area before moving higher. It gets back to that old technical analysis adage "broken resistance becomes support". And the beauty of patterns is that they have defined measurements. This inverse head & shoulder pattern "measures" to the 3015-3020 area so the NASDAQ clearly has the "potential" of another push higher.
So where does the bearishness come in?
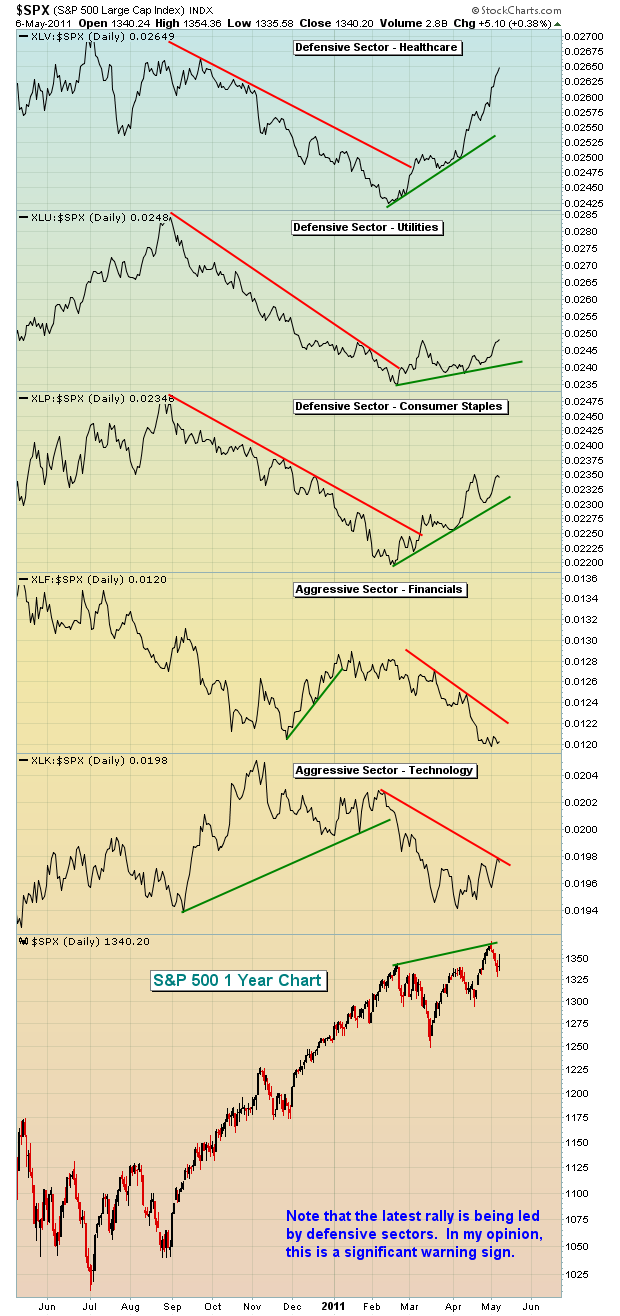
Well, I have a number of reasons, but let's focus on just one for this article. The April rally was led by defensive sectors and that's a no-no during bull markets. Think about it for a second. When you feel bullish about the market, do you rush in to buy Colgate (CL) and Kraft Foods (KFT)? These are "consumer staples" stocks. I know the saying "put your money where your mouth is", but I don't think it applies here. Don't misunderstand me. I'm a huge fan of eating and fresh breath. But if you're bullish, you'll normally want to buy the stocks that generate a bigger return. You're willing to take MORE risk, not less. That suggests you'd rather buy F5 Networks (FFIV) or Netflix (NFLX), technology and consumer discretionary companies, respectively. Yet these two more aggressive stocks did not participate in the latest rally and neither did many with similar characteristics.
Take a look at this relative chart:
It's quite clear to me that when the bull market was in full swing, aggressive sectors led the rally while defensive sectors lagged. This is what I refer to as a "healthy" advance. But note what happened from the mid-February high to the late April high. Defensive groups have emerged as the relative leaders. Money is rotating out of riskier stocks and into the more conservative ones. This suggests a risk-off trading strategy that does not give me the warm and fuzzies as we look ahead. CNBC and the like just look at the numbers, see fresh two year highs and proclaim the bull market perfectly intact. I believe this to be a very serious warning sign that merits close attention, if nothing else.
Could the market march a little higher given those bullish inverse head & shoulders patterns? Absolutely! Is the move sustainable? Given current "under the surface" conditions, not likely. Protect yourself accordingly.
I recently authored a Trader's Boot Camp that was very popular. Many participants suggested more in-depth analysis of the MACD. I am pleased to announce a new topic-specific Boot Camp dealing exclusively with the MACD. If you want to learn about the MACD or just sharpen your skills with helpful hints and strategies, you're invited to sign up for this FREE series of e-mails and annotated charts. CLICK HERE to register and for more information.
Happy trading!


