There are many sentiment indicators that can be followed but the two I most closely follow are the Volatility Index (VIX) and the Equity Only Put Call Ratio (EOPCR). There are sentiment gauges that tell you how investment letter newswriters "feel" about the market. Personally, I'd rather just see where the money is going. I don't need anyone to tell me how they feel. I have unique ways of following both the VIX and the EOPCR, so I thought now might be a good time to discuss one application of each.
My last two articles discussed significant warning signs in the market. I've been communicating this bearish bias regularly to our members at Invested Central. Last week, we saw a bit of confirmation as prices moved substantially lower and major moving averages were taken out in the process. The damage could be seen across all sectors.
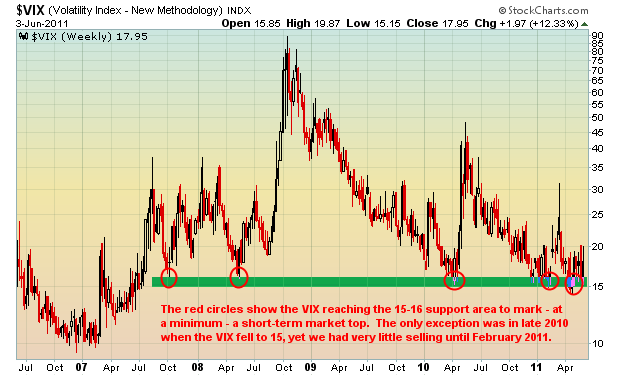
The VIX and the EOPCR were among the warning signs as well. Stock prices and the VIX tend to move inversely to one another. As stock prices rise, the market generally grows more complacent (less volatile) and the VIX falls. Well, take a look at key price support on the VIX since 2007:
The trip back to 15 support suggested a possible bounce and a bounce higher in the VIX is usually accompanied by a market selloff. Last week's selling began right on cue if you follow the VIX. After approaching 15, the VIX popped and the market sold off IMPULSIVELY.
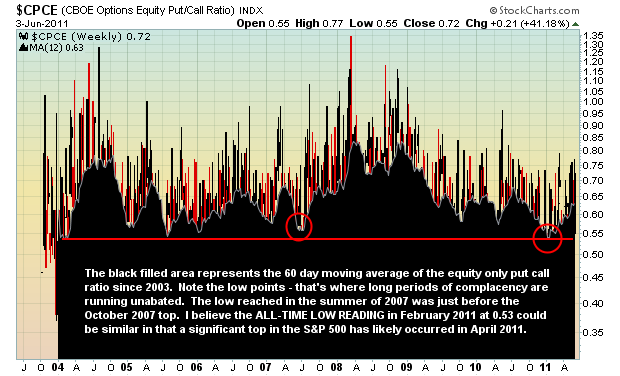
Complacency was also found in the EOPCR. In fact, since the CBOE began providing us data for the equity only put call ratio in October 2003, never had the 60 day moving average of the EOPCR fallen to the level it saw in February 2011. Check this out:
Sentiment alone will not provide us all the evidence we need. It's similar to a jury trial where the defendant can be placed at the scene of a crime. That certainly provides the possibility that the defendant is guilty, but the jury would need more evidence to convict. In the case of the stock market, the preponderance of evidence suggests we've just witnessed a significant market top. On Tuesday, I hosted a State of the Market webinar for our Gold members, highlighting all of the bearish evidence accumulated to date. It's quite alarming. CLICK HERE for more information on viewing this timely and powerful webinar.
We also continue to receive great feedback from our MACD Boot Camp, which is a FREE learning series designed to help you better understand the MACD, its uses, trading secrets, and its limitations. If interested in registering, CLICK HERE.
Happy trading!


