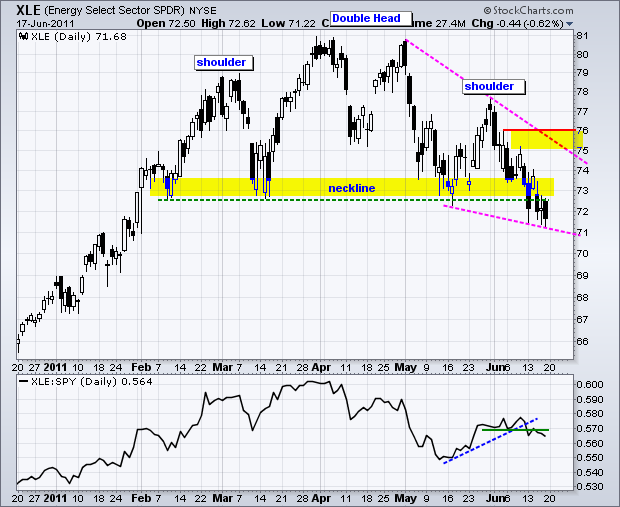
The Energy SPDR (XLE) has been one of the weakest sectors this month. In fact, the chart shows XLE breaking support from a large Head-and-Shoulders reversal pattern. The left shoulder peaked in March, the head peaked in April and the left shoulder peaked at the end of May. With a 7% decline the last 13 days, the ETF broke below the lows extending back to February. This confirms the pattern and targets a move to around 65. The height of the pattern (81 – 73 = 8) is subtracted from the support break (73 – 8 = 65) for a target.

Click this image for a live chart.
At this point, traders need to be careful that the right half of the Head-and-Shoulders pattern does not evolve into a mere falling wedge. Currently, the wedge is clearly falling with no signs of strength. A move above the wedge trendline and resistance at 76 would reverse this fall and put the bulls back in control.


