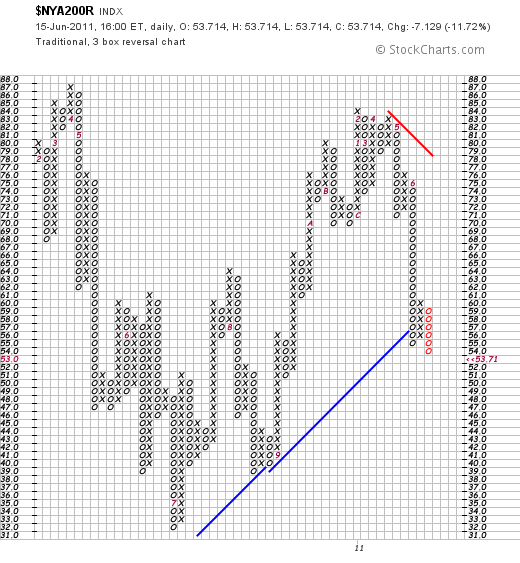
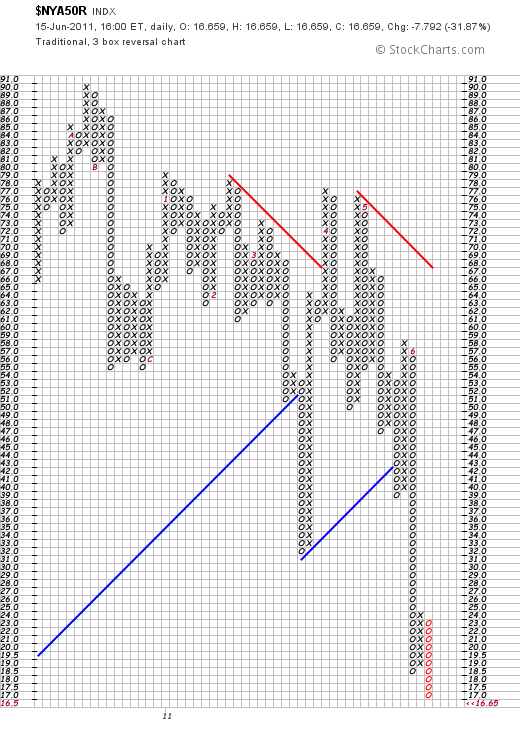
Last Thursday's message showed the point & figure version of the % NYSE stocks above their 200-day moving average in a downside correction. I suggested that the first sign of improvement would be a three-box reversal to a rising X column. We got that this week, but it proved short-lived. That's the bad news. The good news is the p&f chart now gives us a clearcut chart point to use to spot any market upturn. A traditional p&f buy signal requires a rising X column to exceed a previous X column. This week's high point was at 60. That means that the $NYA200R needs to hit 61 to signal a possible upturn. Why this indicator is worth watching is that virtually all major US stock indexes are now testing their 200-day moving averages and major chart support along their March lows. Chart 2 shows the % NYSE stocks above their 50-day averages still in a downtrend but dropping into oversold territory below 20%. That more volatile measure needs to rise to 25 to signal a possible bottom.


