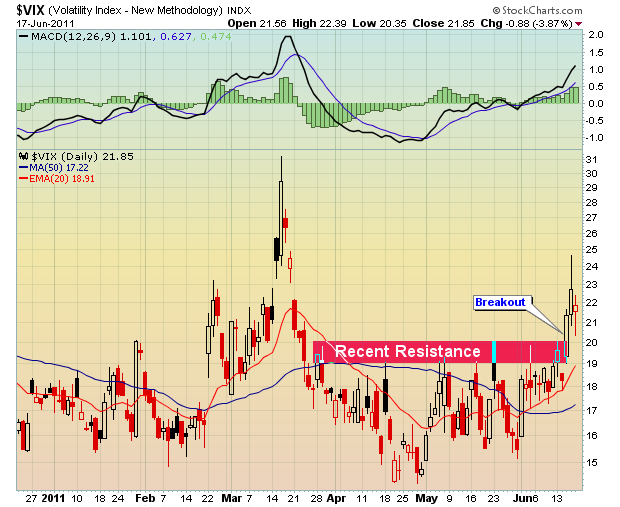
Traders are expecting the horrible market we've seen thus far in June to only get worse. The VIX is the ticker symbol for the Chicago Board Options Exchange Market Volatility Index. It measures implied volatility of S&P 500 index options, or the "expectations" of market action over the next 30 days. The formula takes into account current market prices for all out-of-the-money calls and puts for options expiring in one to two months. The goal is to determine how much premium traders require on option plays. If traders believe higher volatility is in order, then options are priced accordingly with higher premiums.
But therein lies the problem.
Throughout history, higher volatility is associated with weak stock market prices. As the VIX spikes, equity prices drop. Last week, we saw a significant breakout in the VIX and that generally means only one thing for traders - equity prices moving lower. Look at the breakout in the VIX:

Two weeks ago, I mentioned that the VIX had tested key support in the 15-16 range and showed how the VIX had risen on multiple occasions off that support. That VIX strength coincided with market weakness nearly every time and was one of the reasons I had grown more pessimistic about the direction of the stock market recently. Well, the breakout of the VIX beyond resistance only makes me feel more bearish. In addition to declining prices, we now have confirmation that traders are growing more fearful. Price breakdowns + trader fear can equal UGLY market action so remain on your toes.
Taking another look at that VIX chart above, an obvious question surfaces. The VIX rose in March to the 31.00 level, yet the S&P 500 managed to climb to new highs in April. Bulls might ask why is this time any different? Can't we simply move to new highs in July? My answer is that the bearish backdrop was not totally in place in April. If you recall, money flowed into DEFENSIVE sectors in April, telling us it was more of a flight to safety, not another move higher in a bull market. Defensive sectors led the April advance. The three best performing sectors in April were healthcare (+6.43%), consumer staples (+5.35%) and utilities (+4.05%). Financials actually fell in April (-0.06%). That was NOT a healthy advance.
If you're looking for strength in the market now, you'll be hard-pressed to find any. Technical breakdowns litter the charts. It's not likely traders on the long side will remain committed past a few days or a couple percent. And sellers are going to be stacked at key resistance levels like those 20 day EMAs going forward.
I believe the trading environment has turned much more bearish. I discussed the warning signs in the last few articles. These signs have now been confirmed and the summer ahead could be VERY rough indeed. As volatility and fear elevate, trading strategies change. High volatility leads to emotional trading. And any time we get emotion involved, poor trading decisions usually follow.
I will be leading our monthly Online Traders Series webinar, "The Psychology of Trading - What You Must Know NOW" in order to help our members navigate what will likely prove to be a very difficult trading environment in the days, weeks and possibly months ahead. If you'd like more information, CLICK HERE.
Shorting stocks has become a solid option in order to profit from a downtrending market. While I prefer being bullish the market, I have no problem whatsoever recognizing shorting opportunities and seizing them. 11 of our last 12 Charts of the Day have been winners, 10 of which have been short candidates. One of those winning short trades is described in detail, from setup through the cover. CLICK HERE to view it.
Happy trading!


