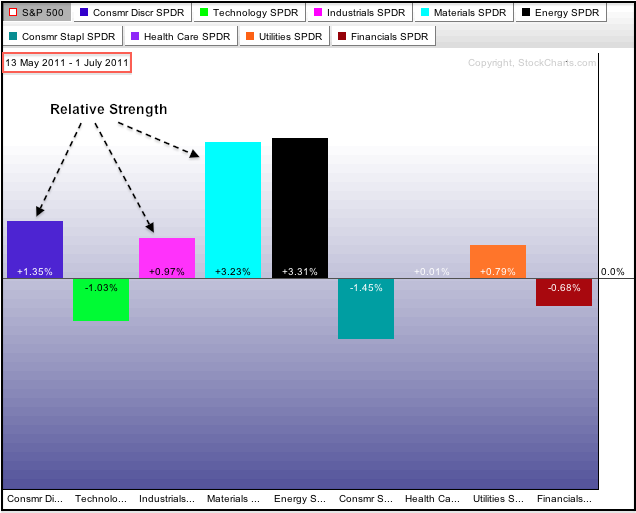
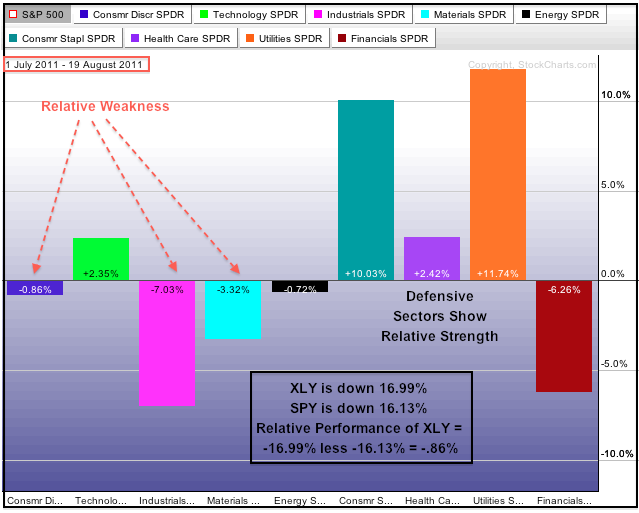
Selling pressure since July 1st pushed the Consumer Discretionary SPDR (XLY) from a market leader to a market laggard. These Sector PerfCharts show the performance for the nine sector SPDRs relative to the S&P 500. The percentage change shown is the relative change, which equals the percent change in SPY less the percent change in the sector SPDR. If XLY is down 16.99% and SPY is down 16.13%, relative performance for XLY would be -.86% (-16.99 less -16.13 = -.86). Sectors with positive bars are outperforming SPY, while sectors with negative bars are underperforming. The first Perfchart extends from May 13th to July 1st. Notice that the Consumer Discretionary SPDR, Industrials SPDR and Basic Materials SPDR are outperforming the broader market (SPY). Also note that the Consumer Staples SPDR is underperforming, while the Healthcare SPDR and Utilities SPDR are slightly outperforming.


Click this image for a live Sector PerfChart
Flash forward to the most recent 35 day period and there is a drastic change in the relative performance PerfChart. First, notice that the Consumer Discretionary SPDR moved from relative strength to relative weakness. The Industrials SPDR, Basic Materials SPDR and Energy SPDR also moved from positions of relative strength to relative weakness. Second, notice that the three defensive sectors now show relative strength. All sectors are down over the last 35 days, but utilities, consumer staples and healthcare are down less than the market. This shows a clear preference for defense, which is bearish for the broader market. The Technology ETF is a bit of an anomaly as it moved from relative weakness to relative strength. This indicates that the sector may lead if and when the market does bounce.


