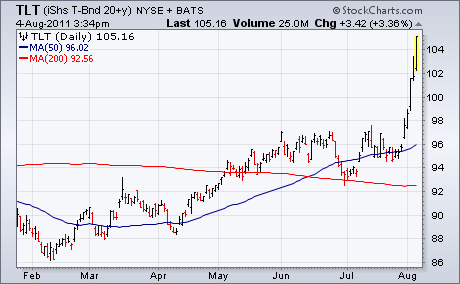
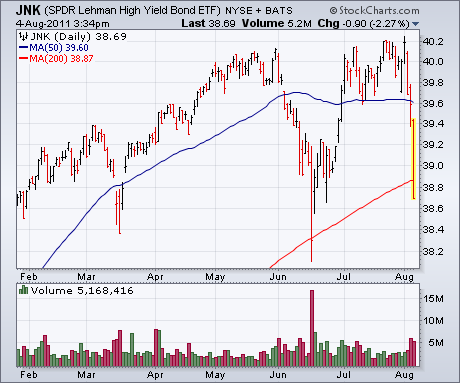
With global stocks and commodities in a rout, most U.S. bonds are surging again. Chart 1 shows the T-Bond 20+Year iShares (TLT) continuing its recent surge (as bond yields tumble to the lowest level in a year). The only exception is high yield corporates. Chart 2 shows the Lehman High Yield Bond ETF (JNK) falling more than 2% and breaking its 200-day moving average. We've pointed out several times in the past that junk bonds are more closely tied to stocks than to bonds. Right now, junk bonds are following stocks lower.

About the author:
John Murphy is the Chief Technical Analyst at StockCharts.com, a renowned author in the investment field and a former technical analyst for CNBC, and is considered the father of inter-market technical analysis. With over 40 years of market experience, he is the author of numerous popular works including “Technical Analysis of the Financial Markets” and “Trading with Intermarket Analysis”. Before joining StockCharts, John was the technical analyst for CNBC-TV for seven years on the popular show Tech Talk, and has authored three best-selling books on the subject: Technical Analysis of the Financial Markets, Trading with Intermarket Analysis and The Visual Investor.
Learn More


